
LPS Evaluation Suite
Explore clearance data in great detail: 2D cross section, 3D point cloud, platforms and overhead line
Clearance profile evaluation software for LPS data — static and dynamic clearance, platforms, overhead line equipment (OLE), 3D point cloud and track geometry graphs
Why Choose LPS Evaluation Suite?
Static and Dynamic Clearance
Compare the measured profile with your reference clearance profile as it is, or widened in curves the way a vehicle really sweeps through them.
2D and 3D Views
Every section can be inspected as a 2D cross section or as a 3D point cloud with the reference profile drawn in, and the distance of any object measured directly.
Platforms and Overhead Line
Built-in modules detect platform edges and the overhead line equipment (contact wire, registration points, masts) automatically and check them against tolerances.
Reports and Map
Each module produces its own report, and the measured section is shown on the map with the reference profile infringements marked.
See It in Action
Screenshots from the application
LPS Evaluation Suite in 44 seconds: a walk through the 3D point cloud of a tram line, the 2D cross section, contact wire stagger and height graphs with the exceedances and the OLE clearance report in Excel
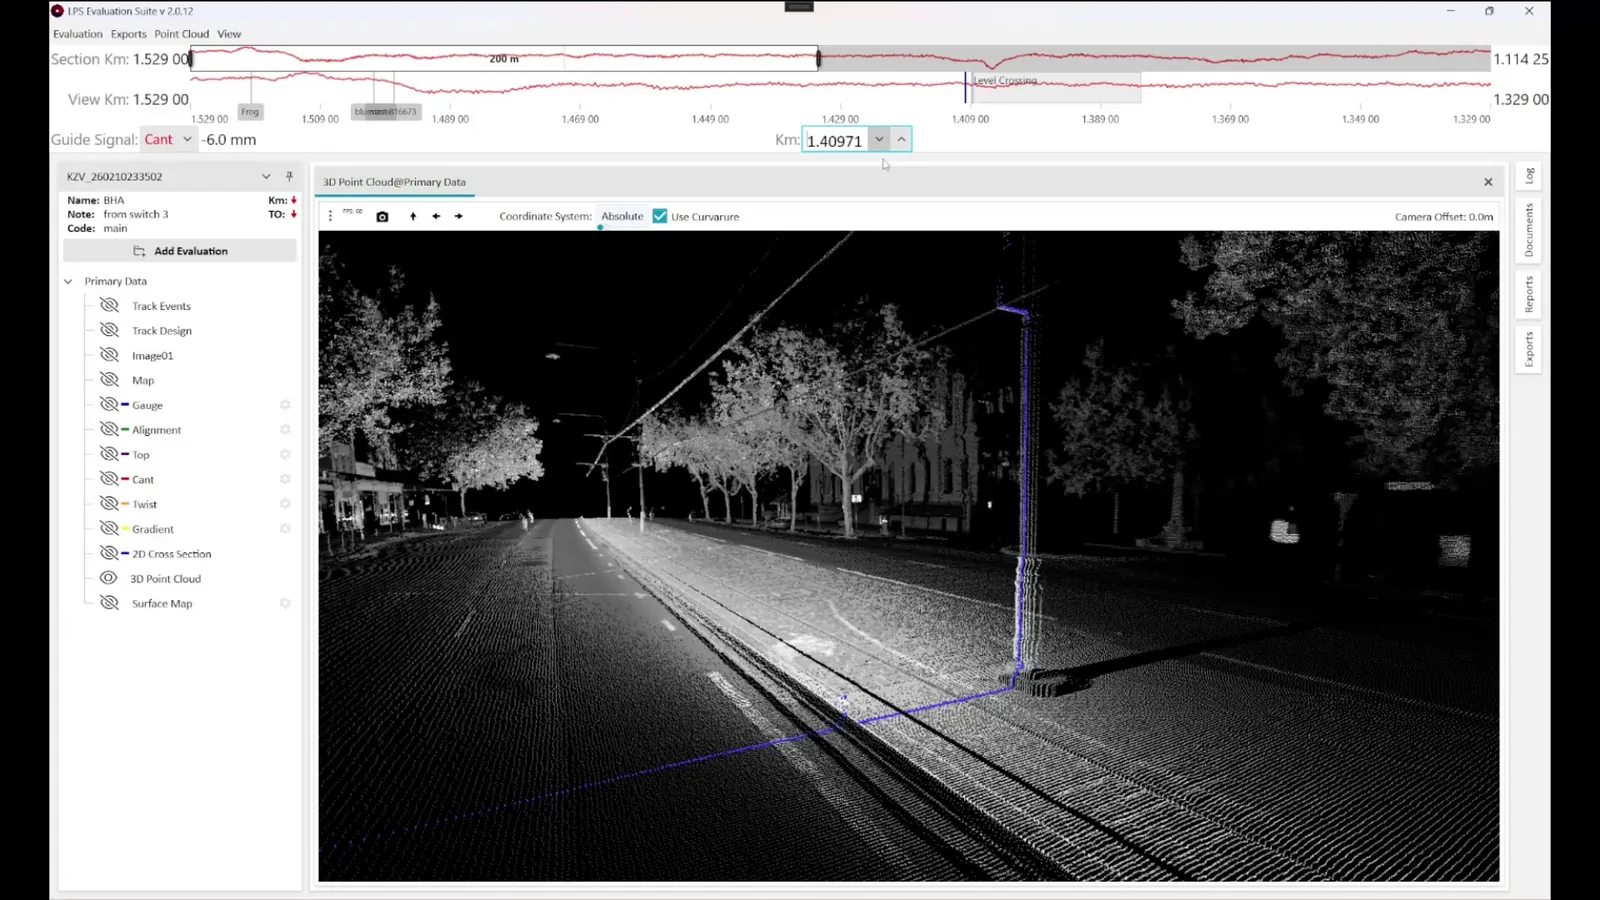
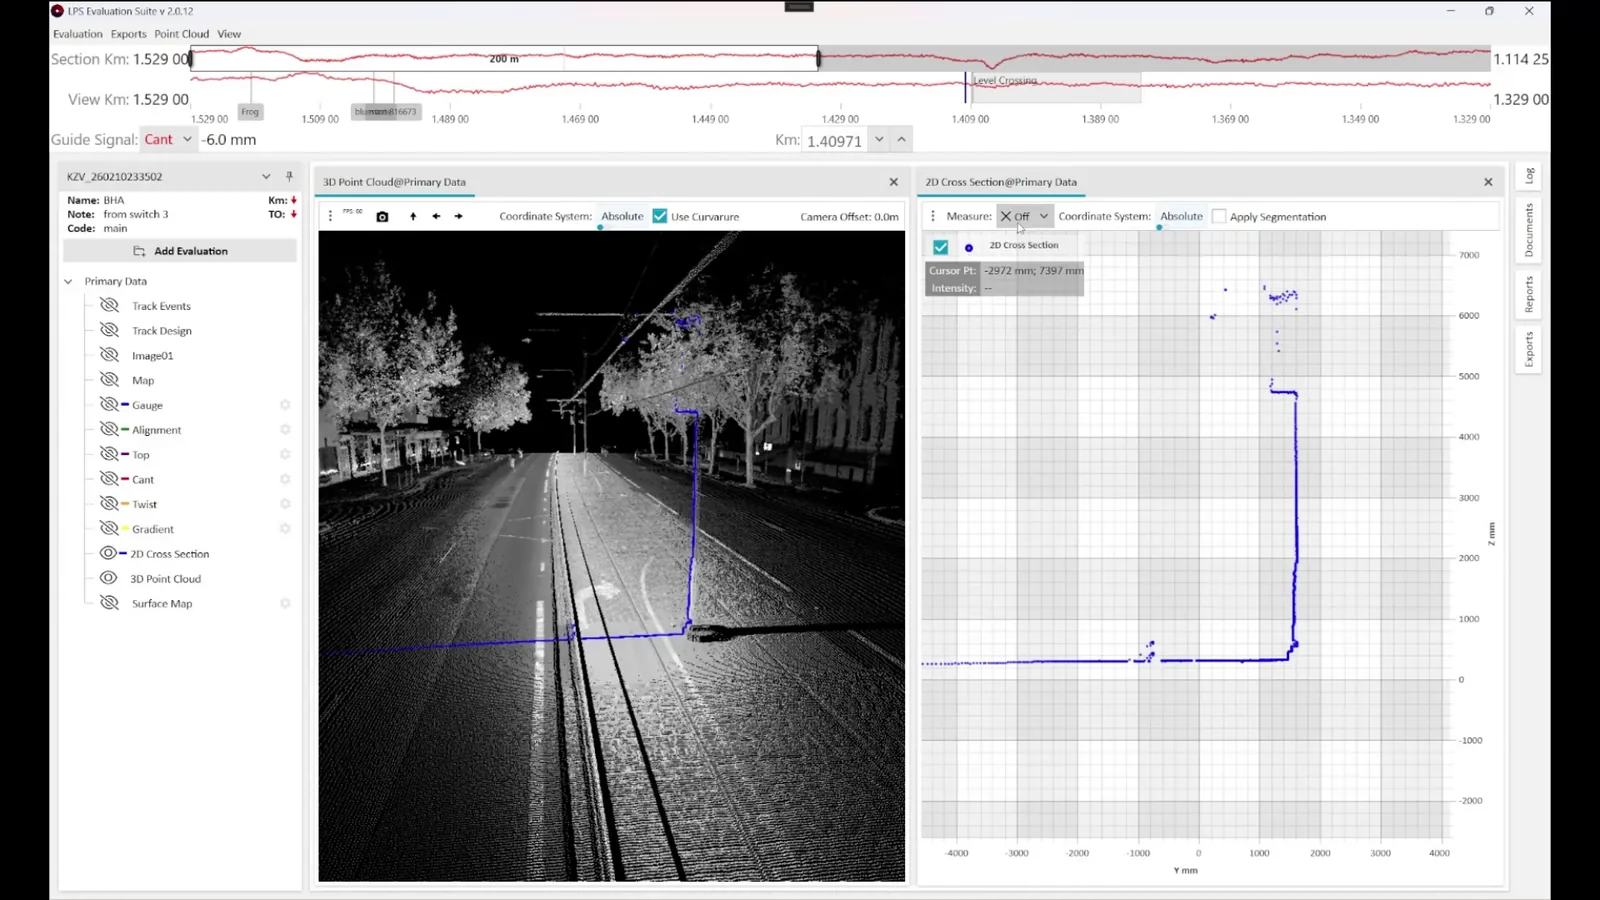
3D point cloud of a tram line at night: rails, road, trees, masts and the contact wire, with the cross section marked in blue
The same place as a 2D cross section next to the point cloud, with the cant graph of the whole section above
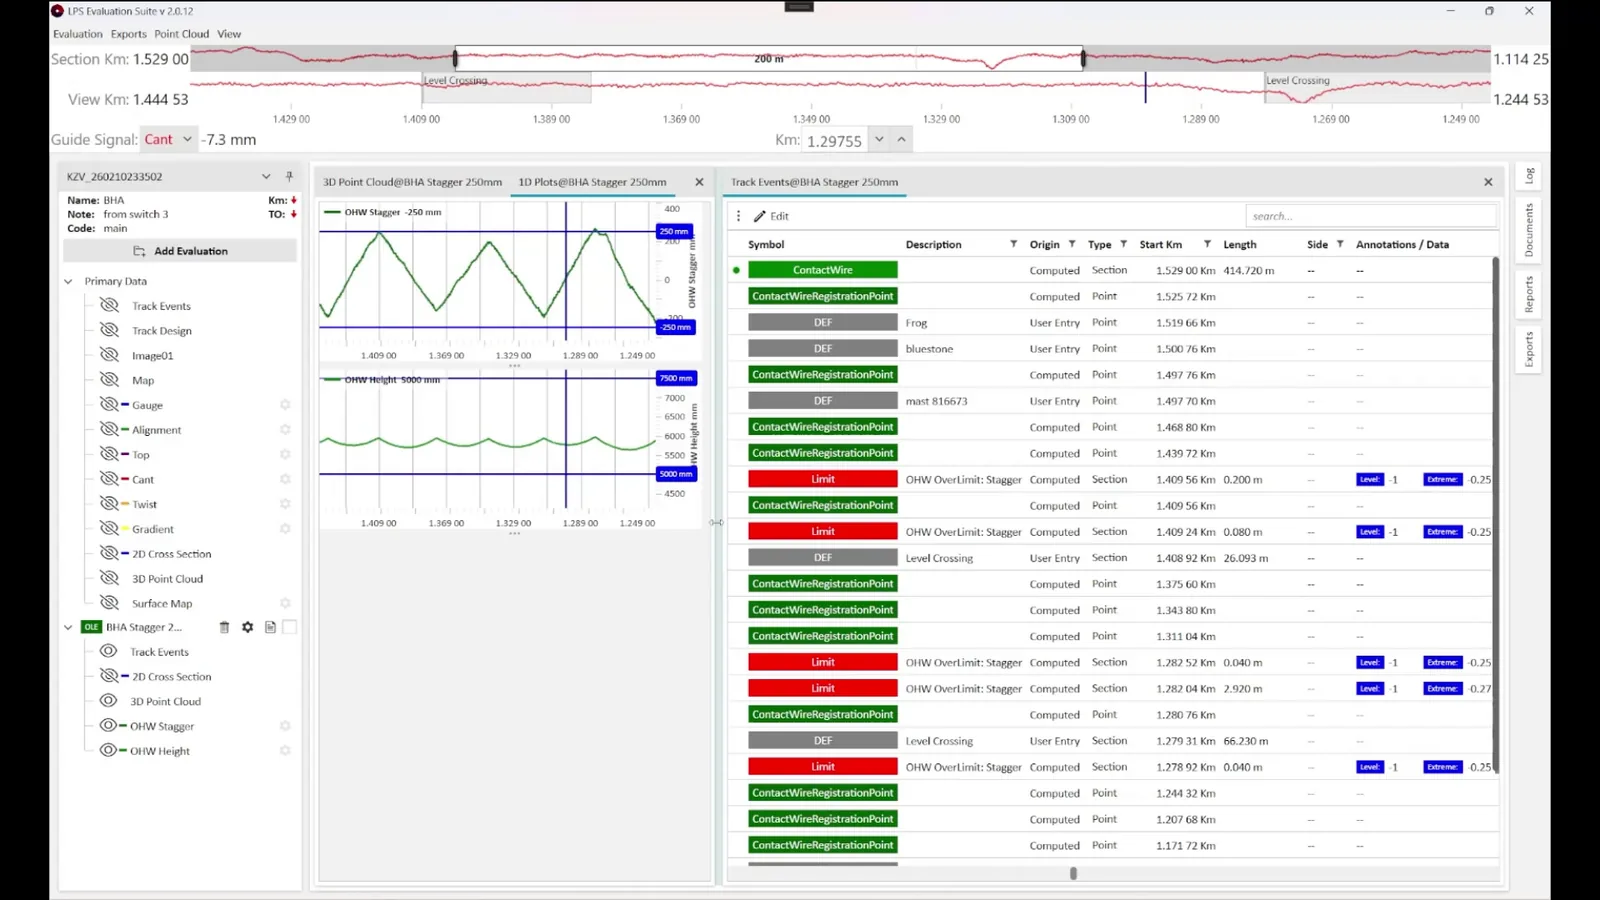
Contact wire stagger and height along the section with the limits, and the track events table with the exceedances in red
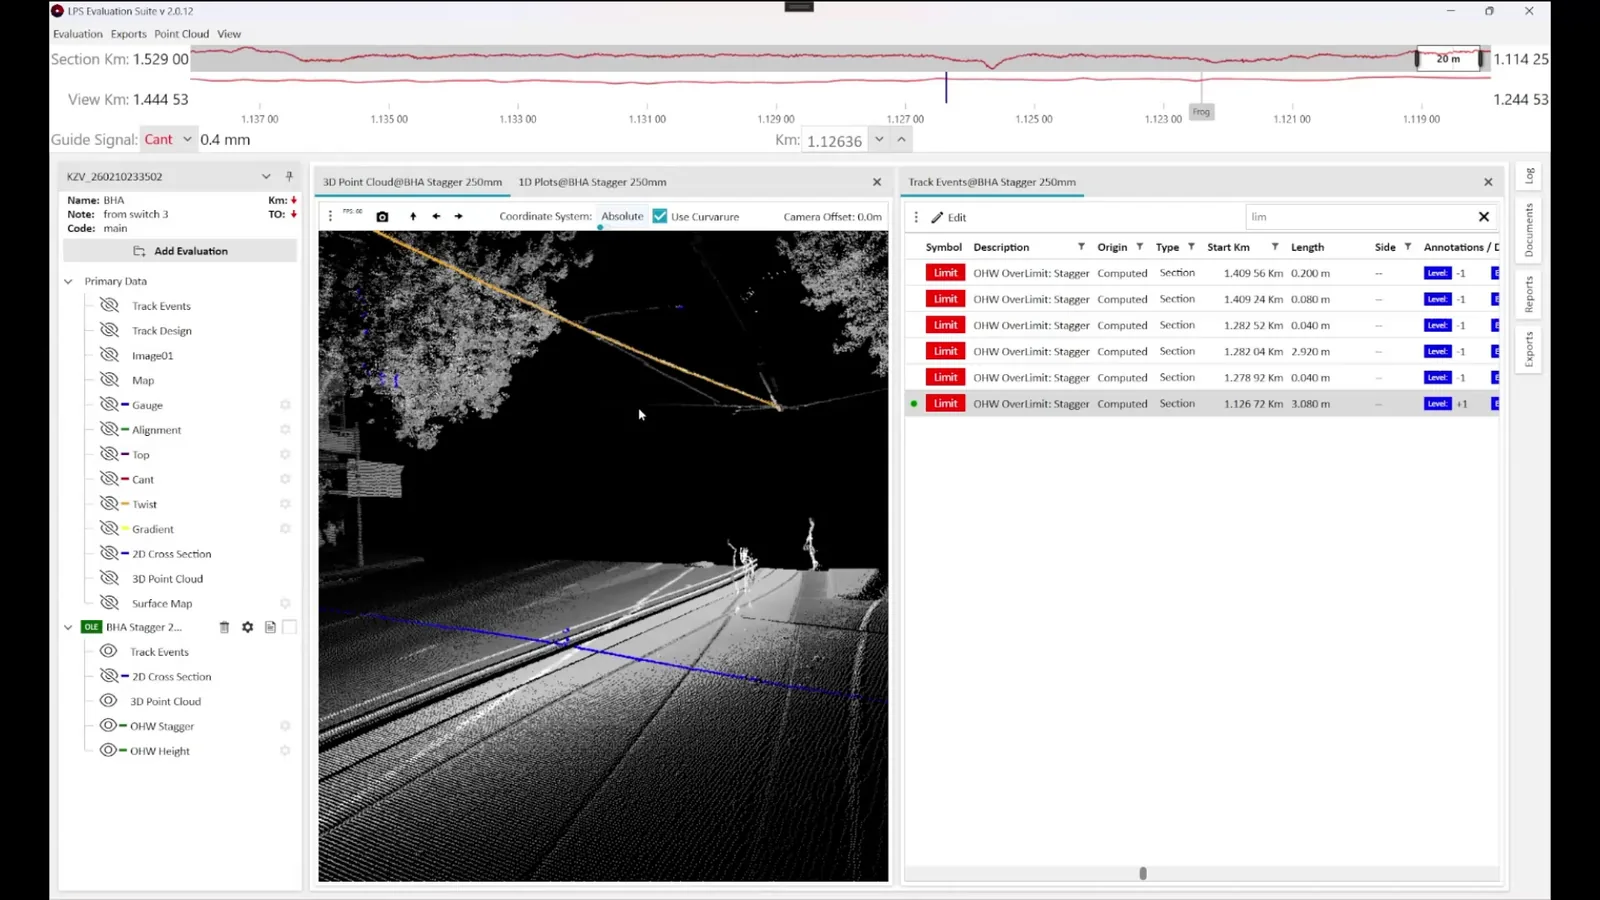
Exceedance list filtered to the limit violations, each with its kilometer position, length and class; the point cloud shows the place
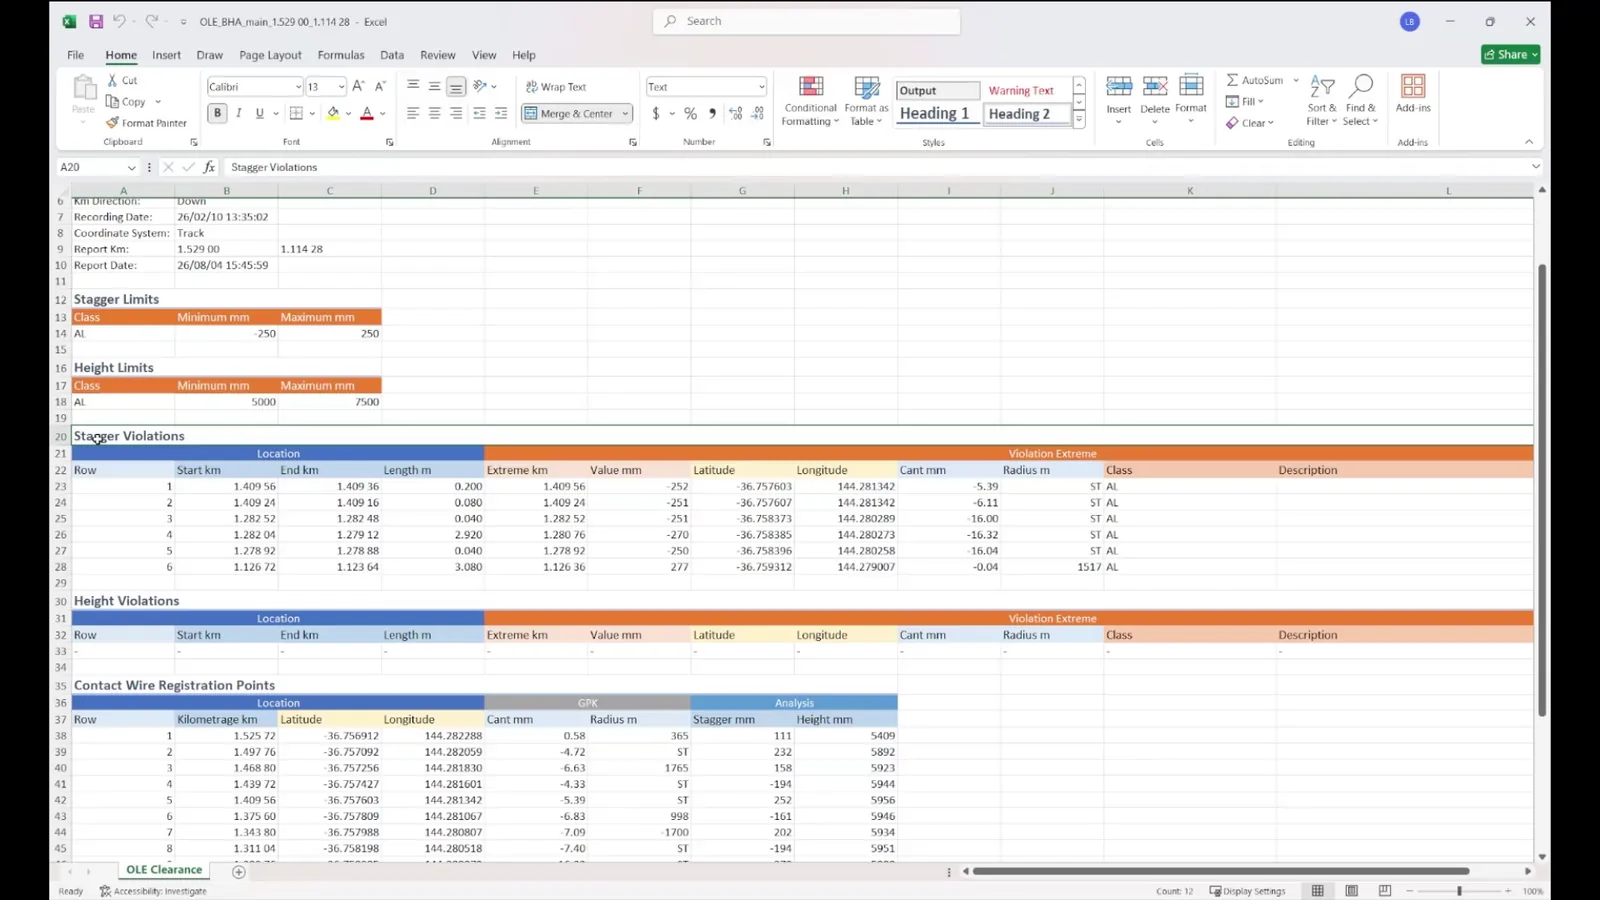
OLE clearance report exported to Excel: limits, stagger and height violations with coordinates, and the contact wire registration points
Key Features
Static Clearance
Comparison of the measured profile with the reference clearance profile of the line
Dynamic Clearance
The reference profile is widened in curves, so the space a vehicle really needs is checked
2D Cross Section
Overall clearance inspection section by section, with manual distance measurement of any object from the clearance profile
3D Point Cloud
Complete overview of the measured track with the user-defined reference clearance profile in 3D and direct distance measurement of any object
Overhead Line Equipment (OLE)
Automatic separation of the contact wire height and stagger signals with tolerances, detection of contact wire registration points and mast positions
Platforms
Automated detection of the platform edge: offset from the track center and platform edge height
Track Geometry Graphs
Basic graphs of the track geometry parameters recorded by the trolley during the same run
Surface Distance Map
Colored 360° map of the distances to the surroundings along the track
Map View
The measured section on the map with the reference profile infringements indicated
Technical Specifications
| Platform | Windows |
|---|---|
| Input Data | LPS measurements recorded with Krab OnBoard 2.0 (KZV format) |
| Evaluation Modes | Static clearance, dynamic clearance (widened in curves) |
| Outputs | Clearance, platform and OLE reports, map with infringements |
Compatible Hardware
This software works with the following KZV products:
What a Clearance Profile Is
The clearance profile (structure gauge) is the space that has to stay free around the track for vehicles to pass safely. Anything inside it — a platform edge, a signal, a tunnel wall, vegetation, a wire at the wrong height — is a risk. The LPS scanner records everything around the track, and LPS Evaluation Suite compares it with the clearance profile that applies to the line.
One Run, Several Modules
The 2D cross section is the module for the overall clearance inspection, section by section; the distance of any object from the clearance profile can be measured manually there, and in the 3D point cloud directly against the reference profile drawn in 3D. The overhead line equipment and the platform modules run automatically on the same data. The track geometry parameters that the KRAB trolley records during the same run — gauge, cant, alignment, top and twist — are available as basic graphs. Ballast profile evaluation is being prepared as a further module.
From Measurement to Report
- Measure with the LPS scanner on a KRAB trolley; Krab OnBoard 2.0 shows the clearance profile live, together with the track geometry or the rail profiles.
- Copy the data to a USB flash drive after the run.
- Evaluate in LPS Evaluation Suite on a PC: choose the reference profile, run the modules, inspect the sections in 2D and 3D. Reference profiles are prepared to the customer's specification, or by the customer; there is no fixed library.
- Report the platform, overhead line and clearance results and hand over the map with the infringements.
Videos
LPS Scanner
The LPS laser scanner on a KRAB trolley, capturing high-resolution 3D profiles of tunnels, platforms, overhead wires and vegetation while measuring track geometry and rail profiles in the same pass.
Ready to Get Started?
Contact us for detailed information, pricing, training, and technical support