
KRAB 11
Evaluation and reporting for track geometry, rail profiles and switches
Professional Windows software for the evaluation, analysis and reporting of track geometry, rail profiles and switches
Standards Compliance
✓ EN 13848-1 • EN 13848-2 • EN 13848-5
Why Choose KRAB 11?
Configurable Evaluation Templates
Every network has its own rules. Define calculations, limits, wavebands, speed zones and reporting criteria once, then reuse the template across all projects.
Complete Track Assessment
Track geometry graphs, local defects, section evaluation, quality indices, rail profiles and switches — the whole infrastructure condition in one program.
Defects Located on the Map
Every detected defect carries its maximum value, length, limit level and GPS position, and the measured track is shown on the map view.
Reports Engineers Can Use
Clear tables, multi-channel graphs and printable reports that turn large measurement datasets into concrete maintenance decisions.
See It in Action
Screenshots from the application
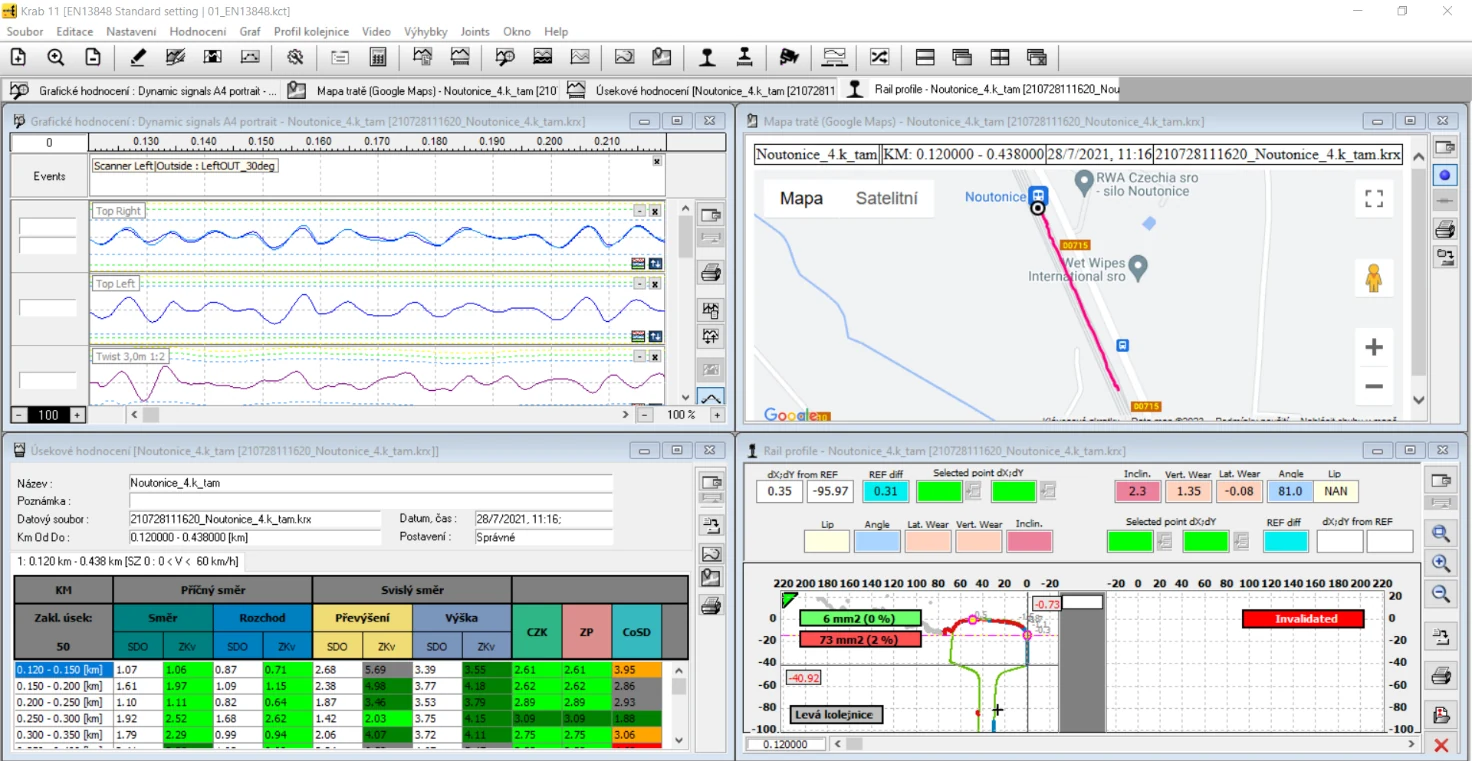
KRAB 11 in 45 seconds: rail profile comparison, geometry graphs, the local defects table and the measured track on the map
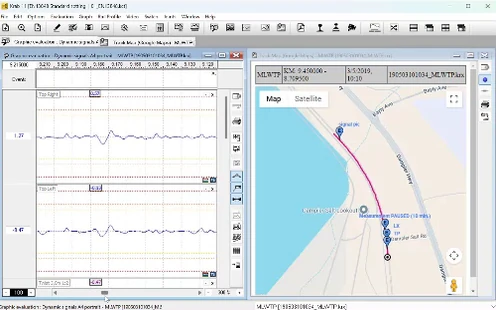
Measured track shown on the map alongside the track geometry graphs
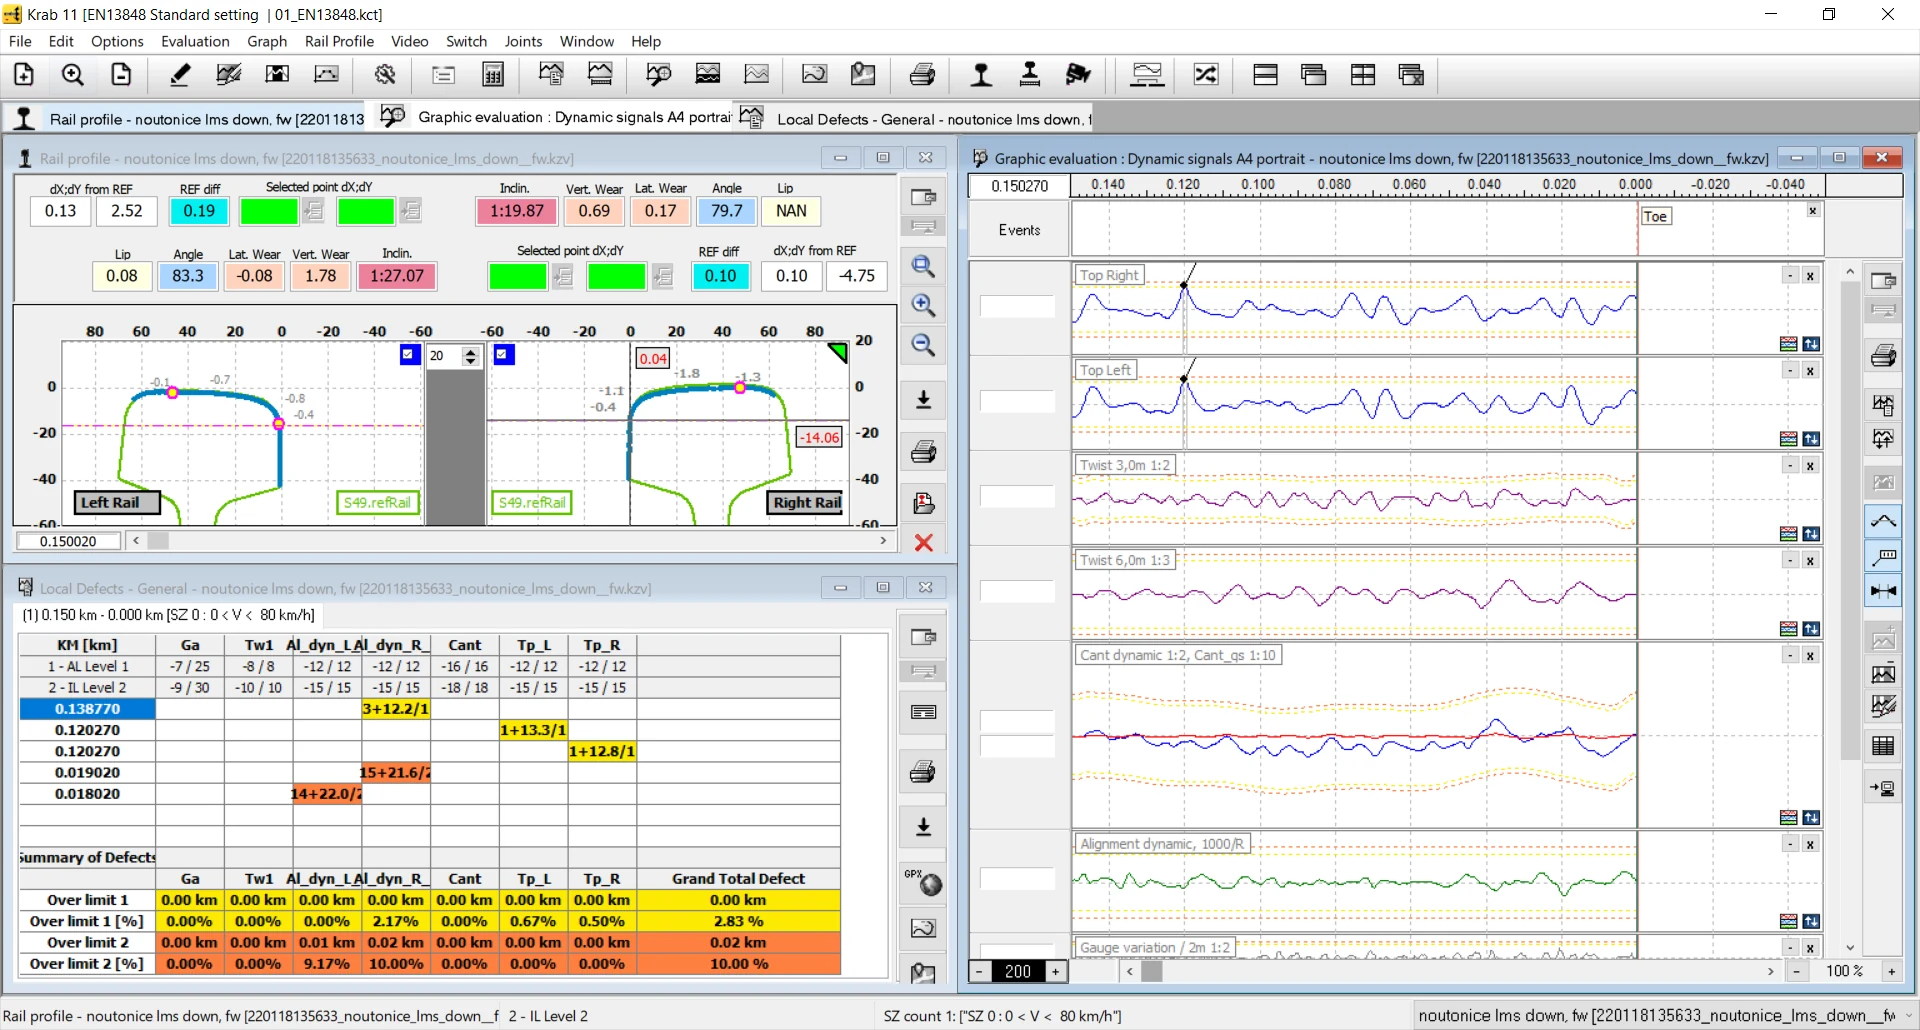
Graphic evaluation, rail profiles and the local defects table open side by side
Evaluation outputs: graphs, map and result tables of one measurement
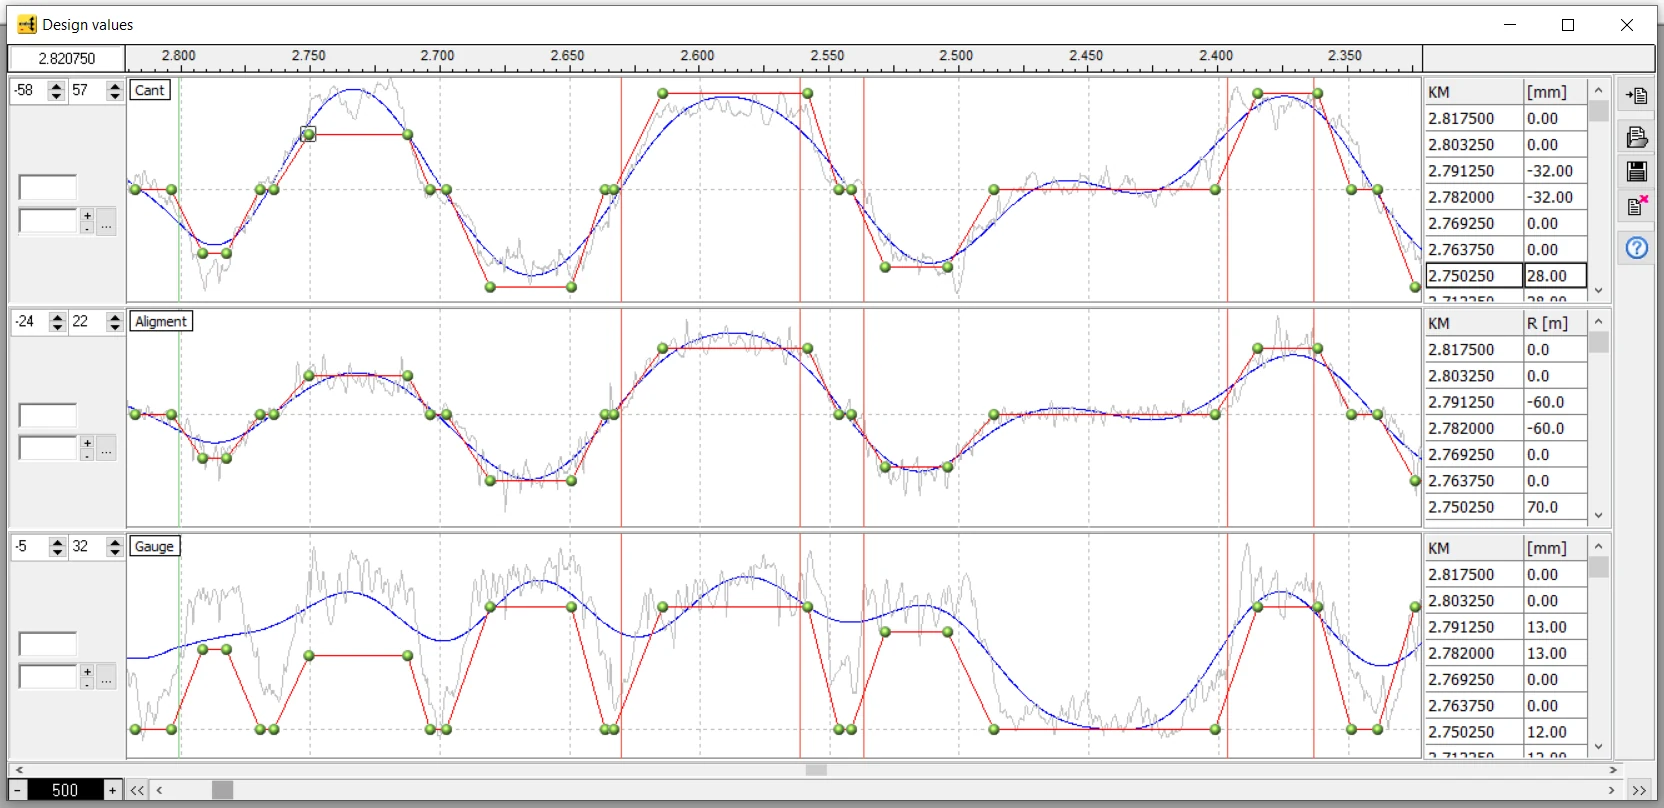
Design values: measured cant, alignment and gauge against the design geometry
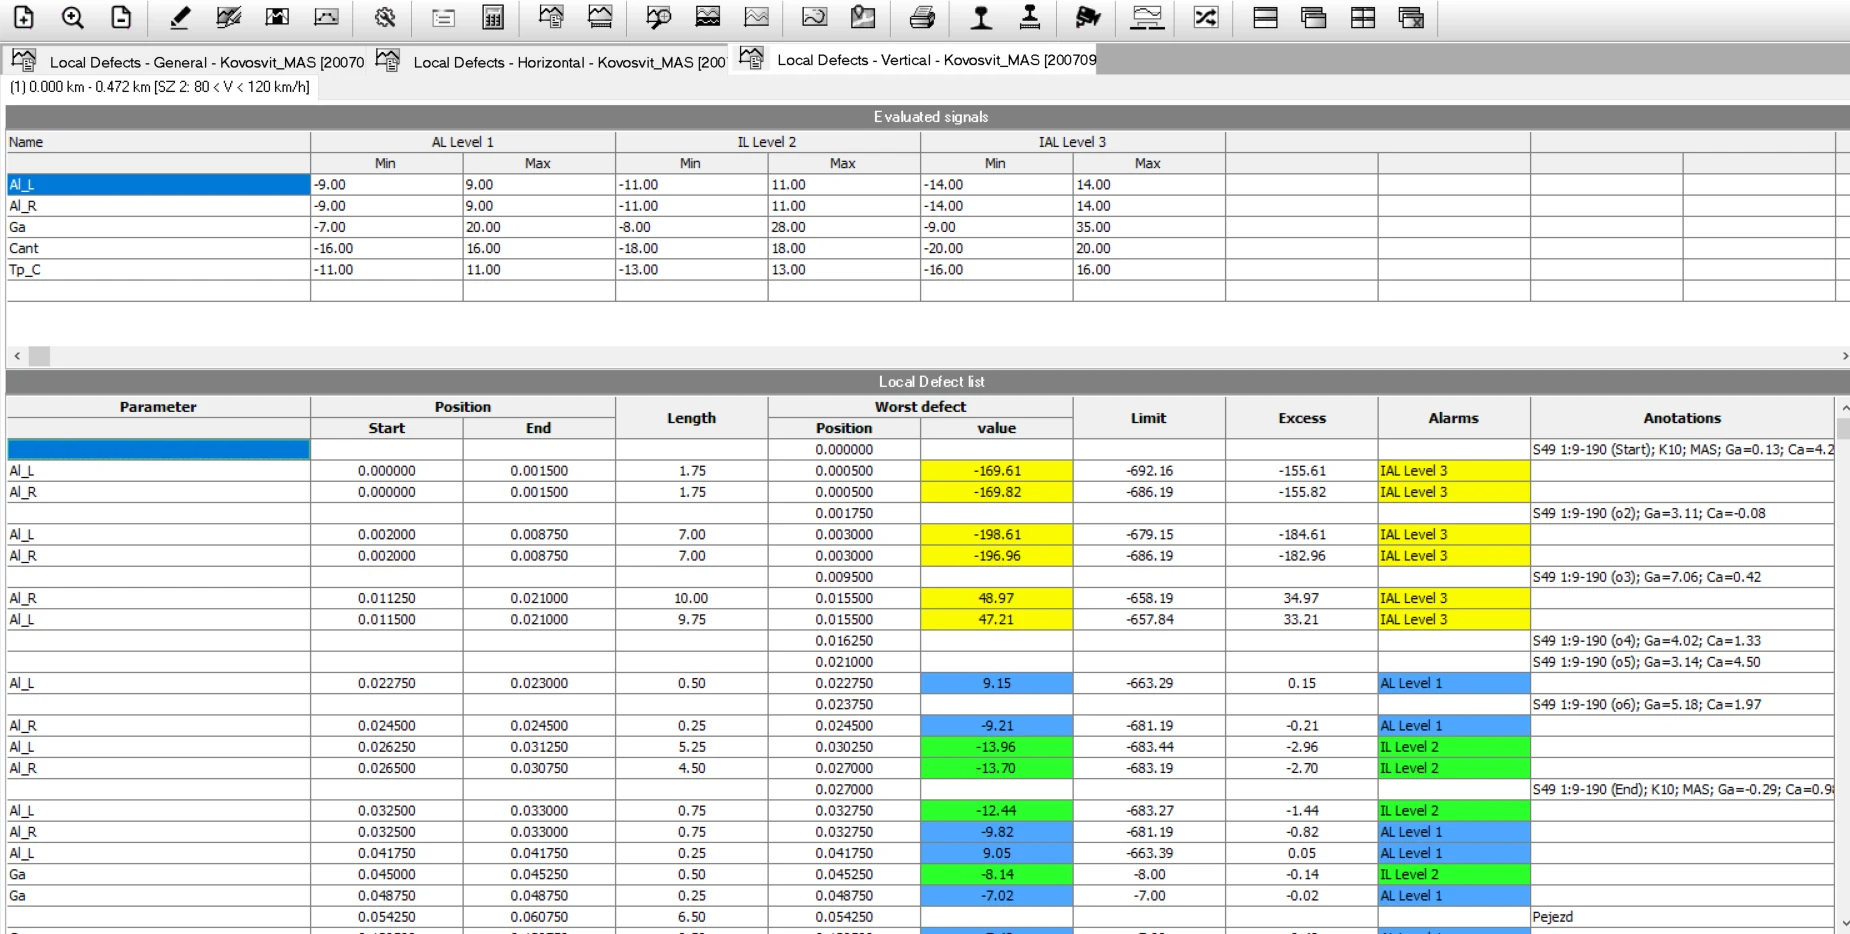
Local defects listed with position, length, worst value, limit and alarm level
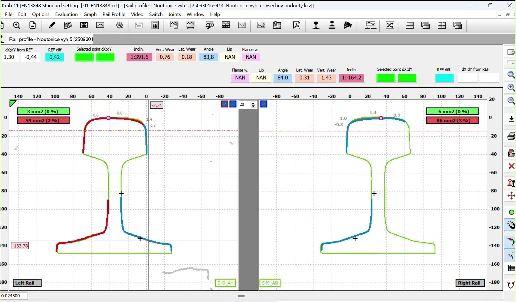
Measured rail profile compared with the selected reference profile
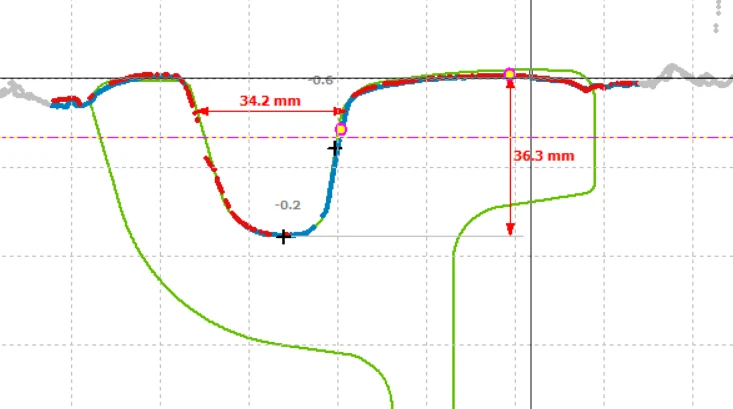
Grooved rail: measured profile against the reference with wear values
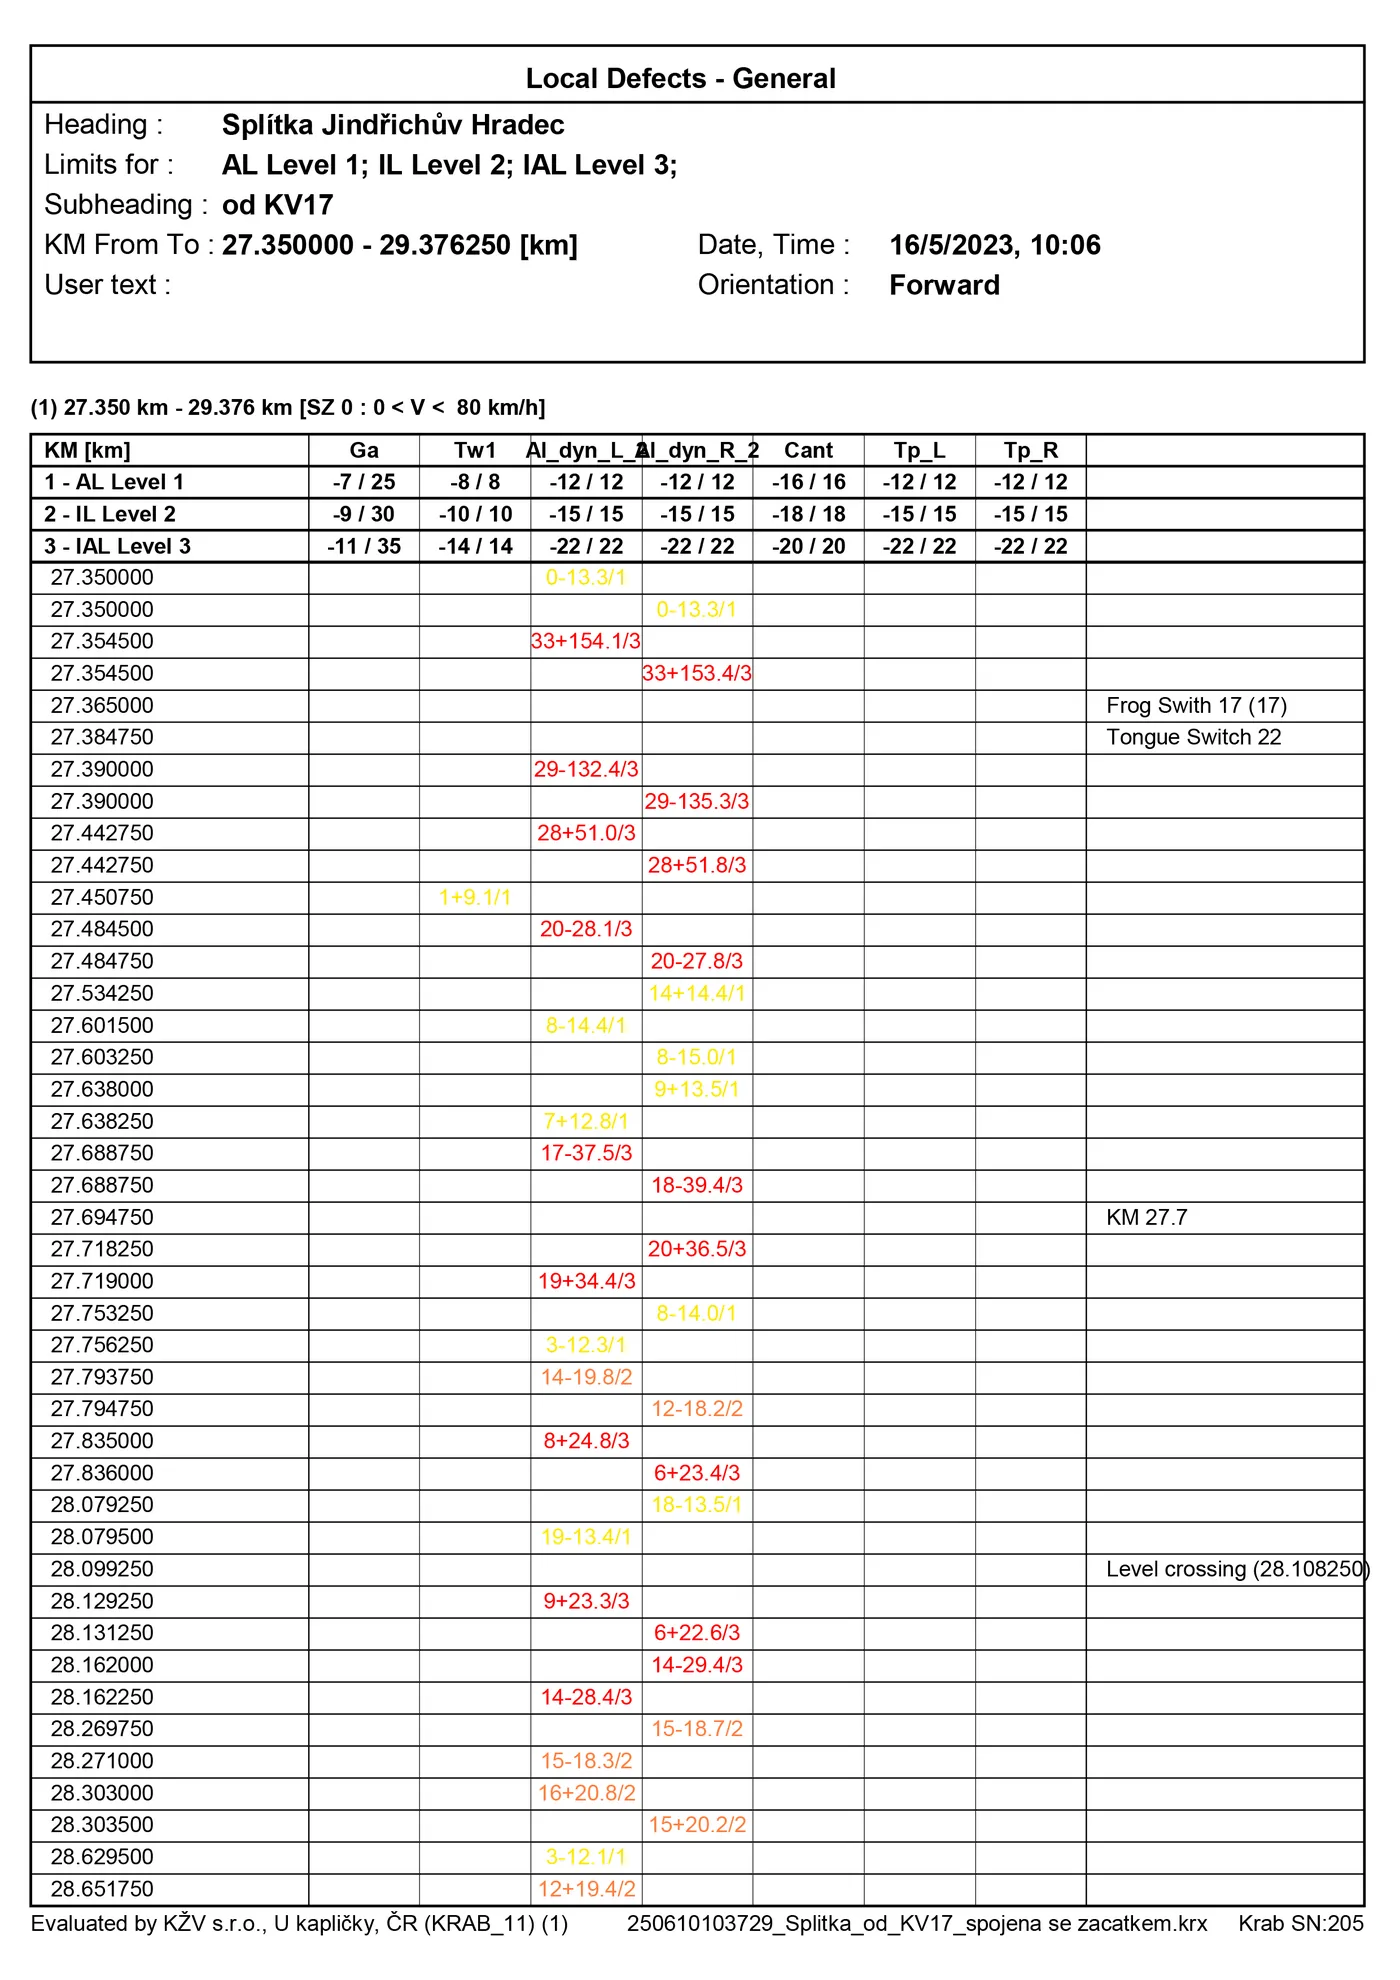
Report: local defects with maximum value, length, limit level and GPS location
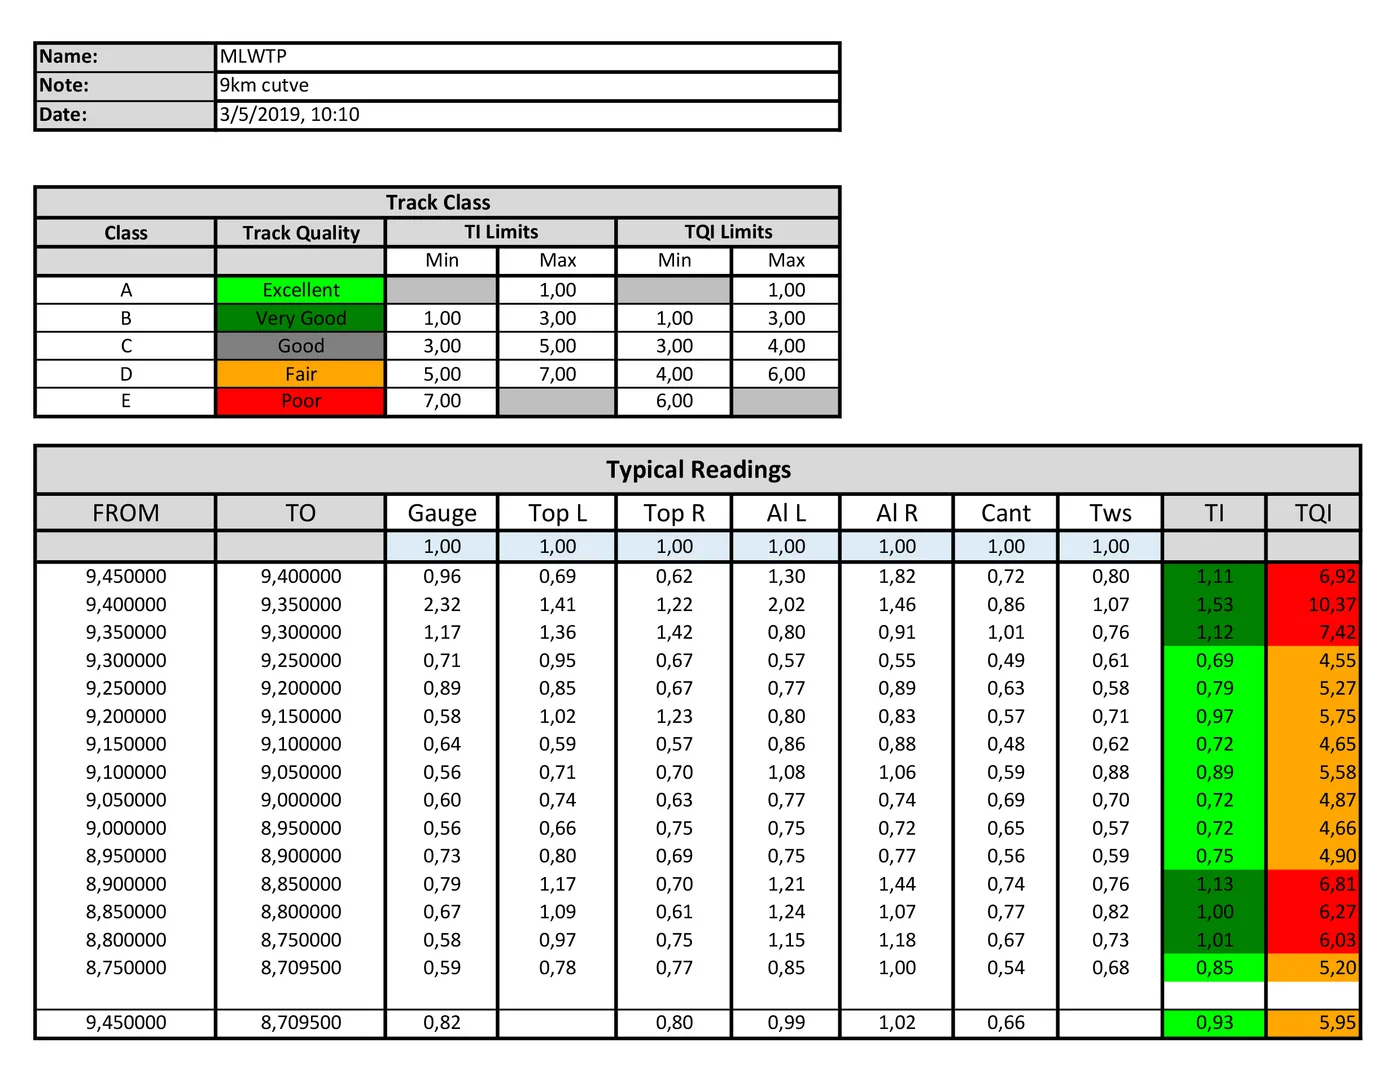
Report: quality index graph for the evaluated track section
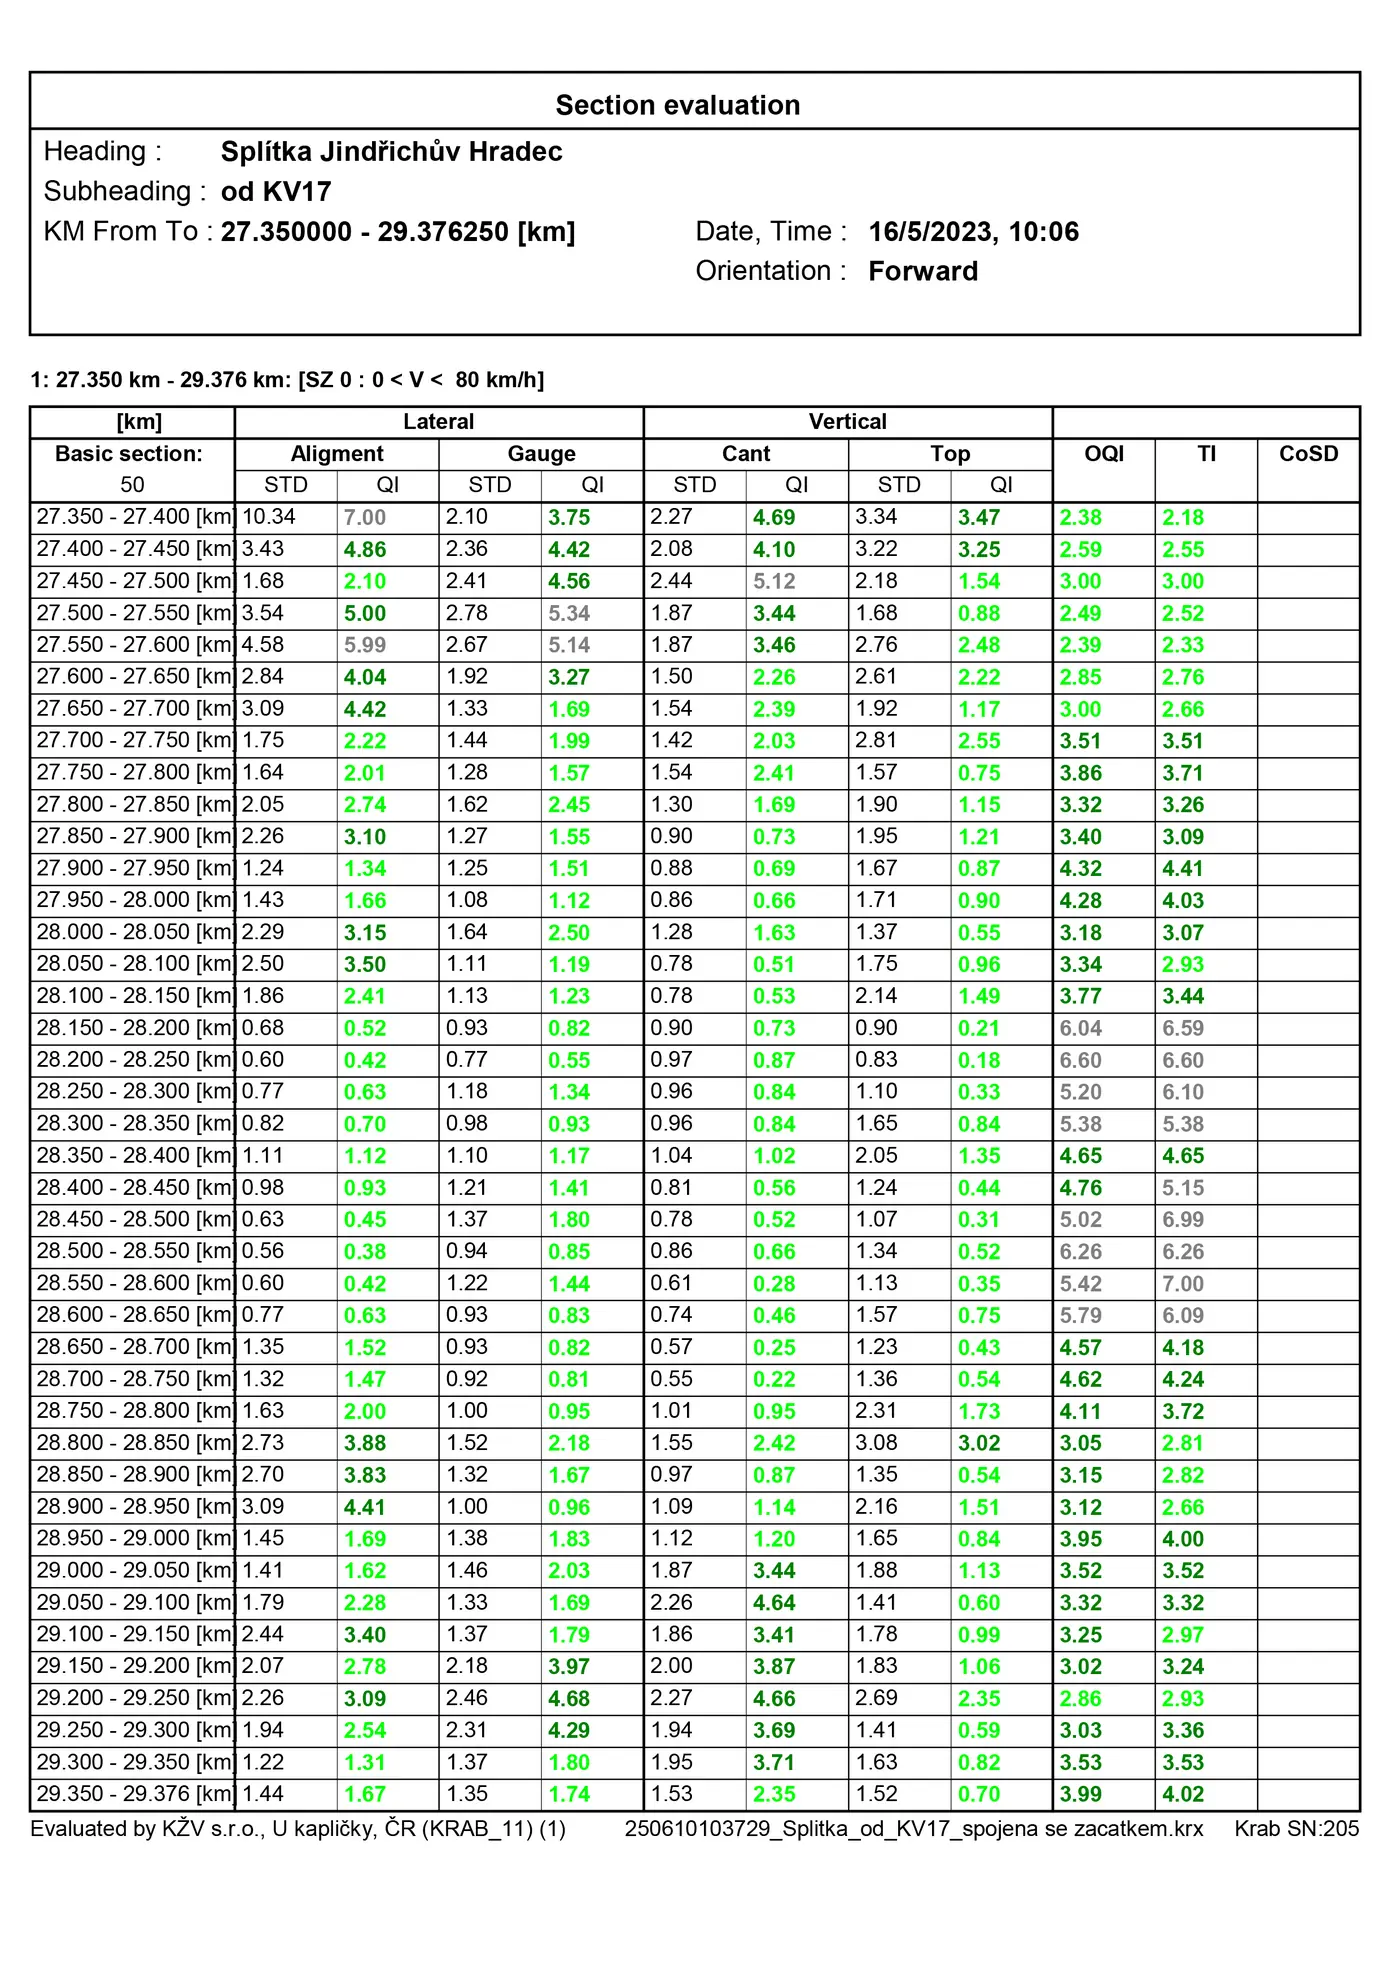
Report: section evaluation with acceptance and maintenance criteria
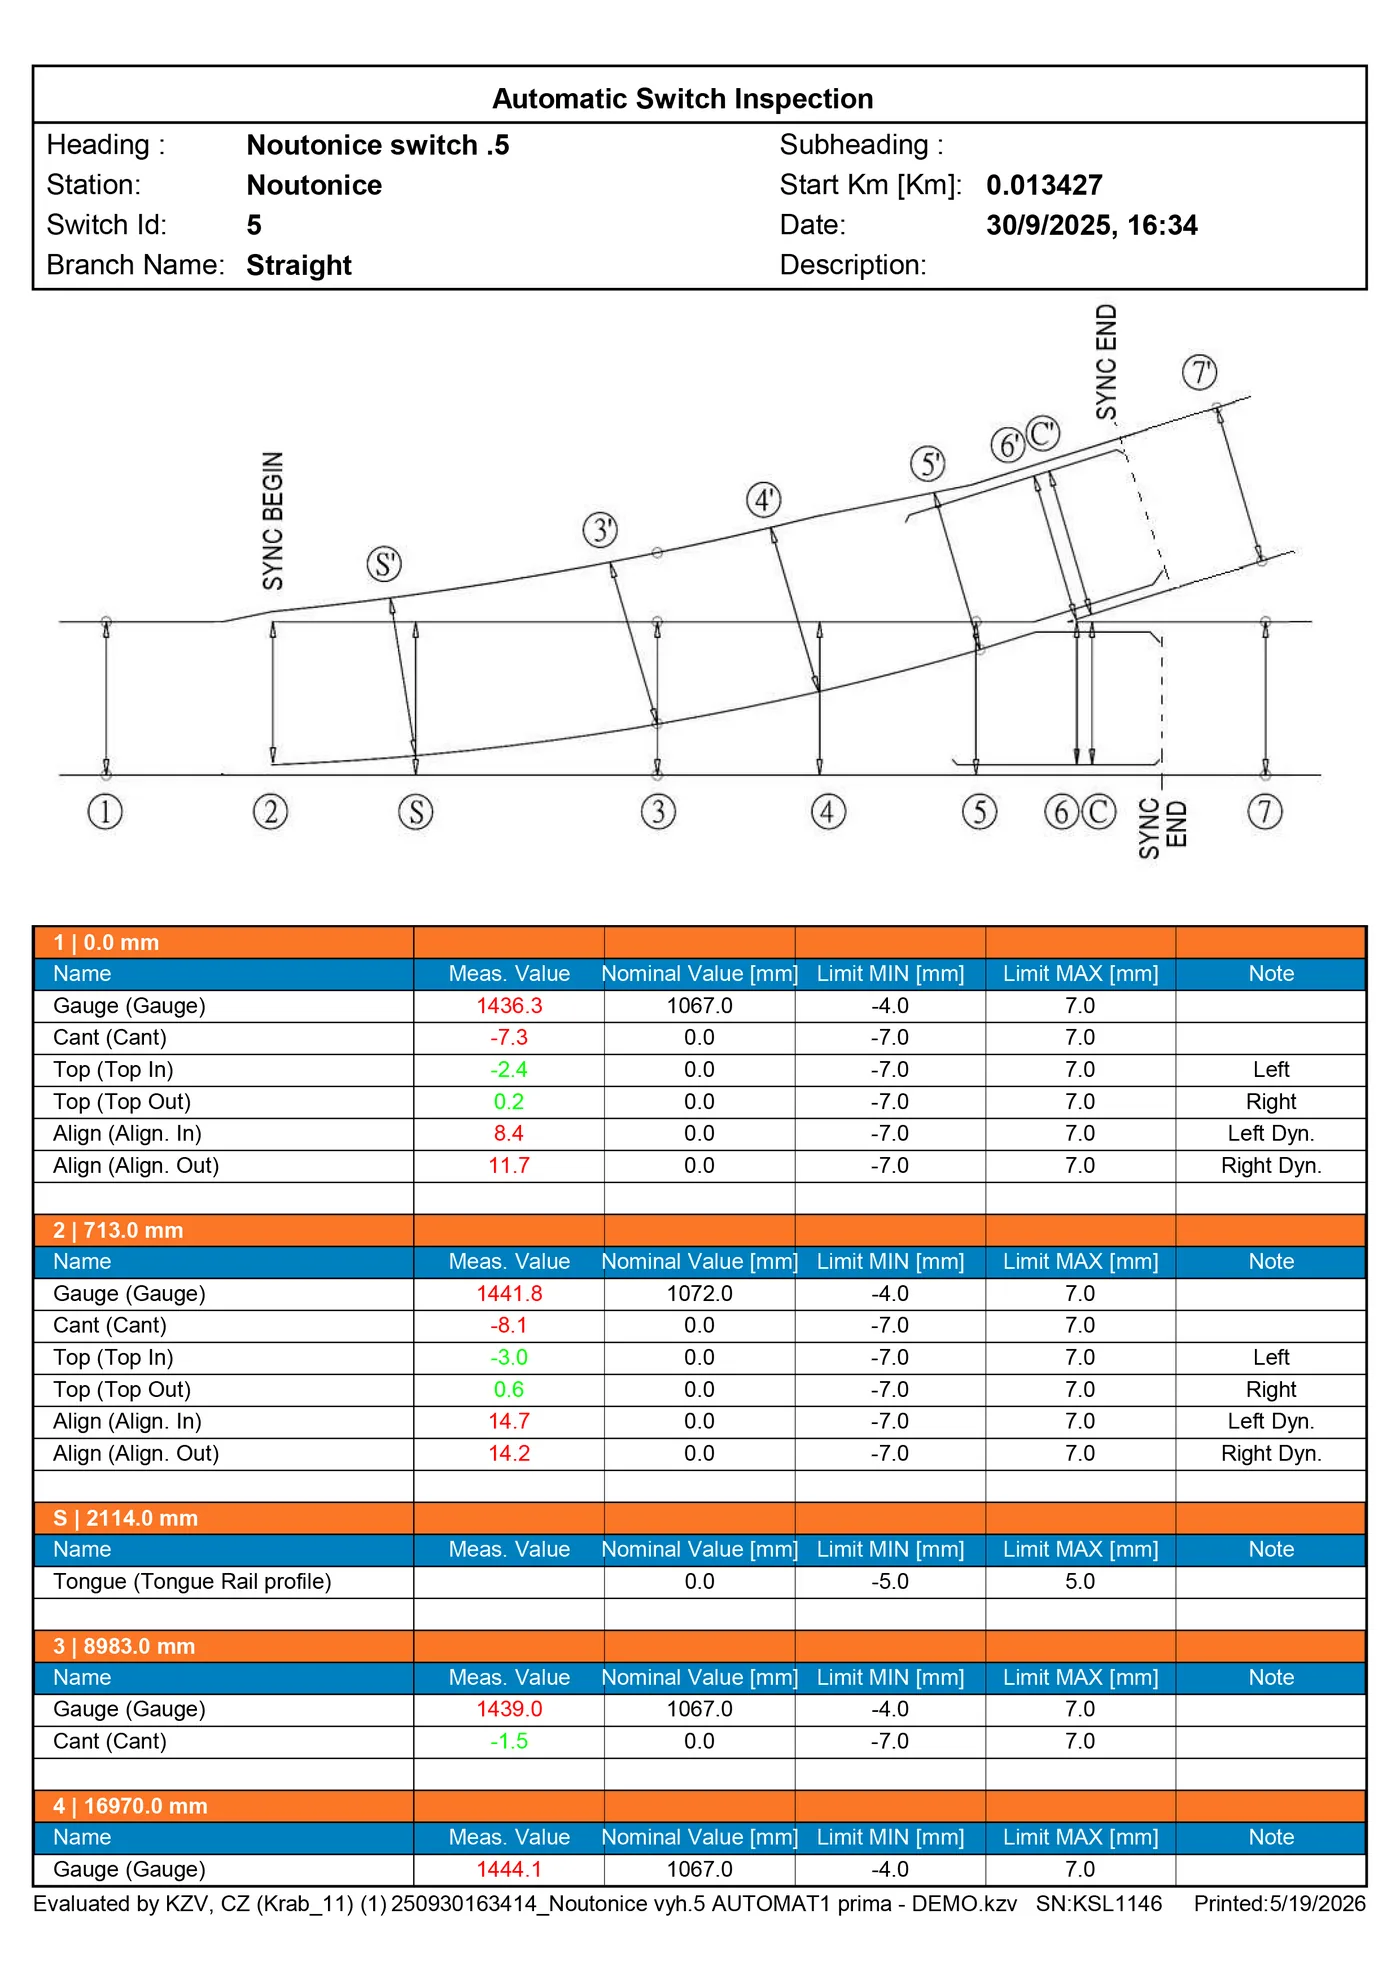
Report: ASI switch geometry at every inspection point of the switch
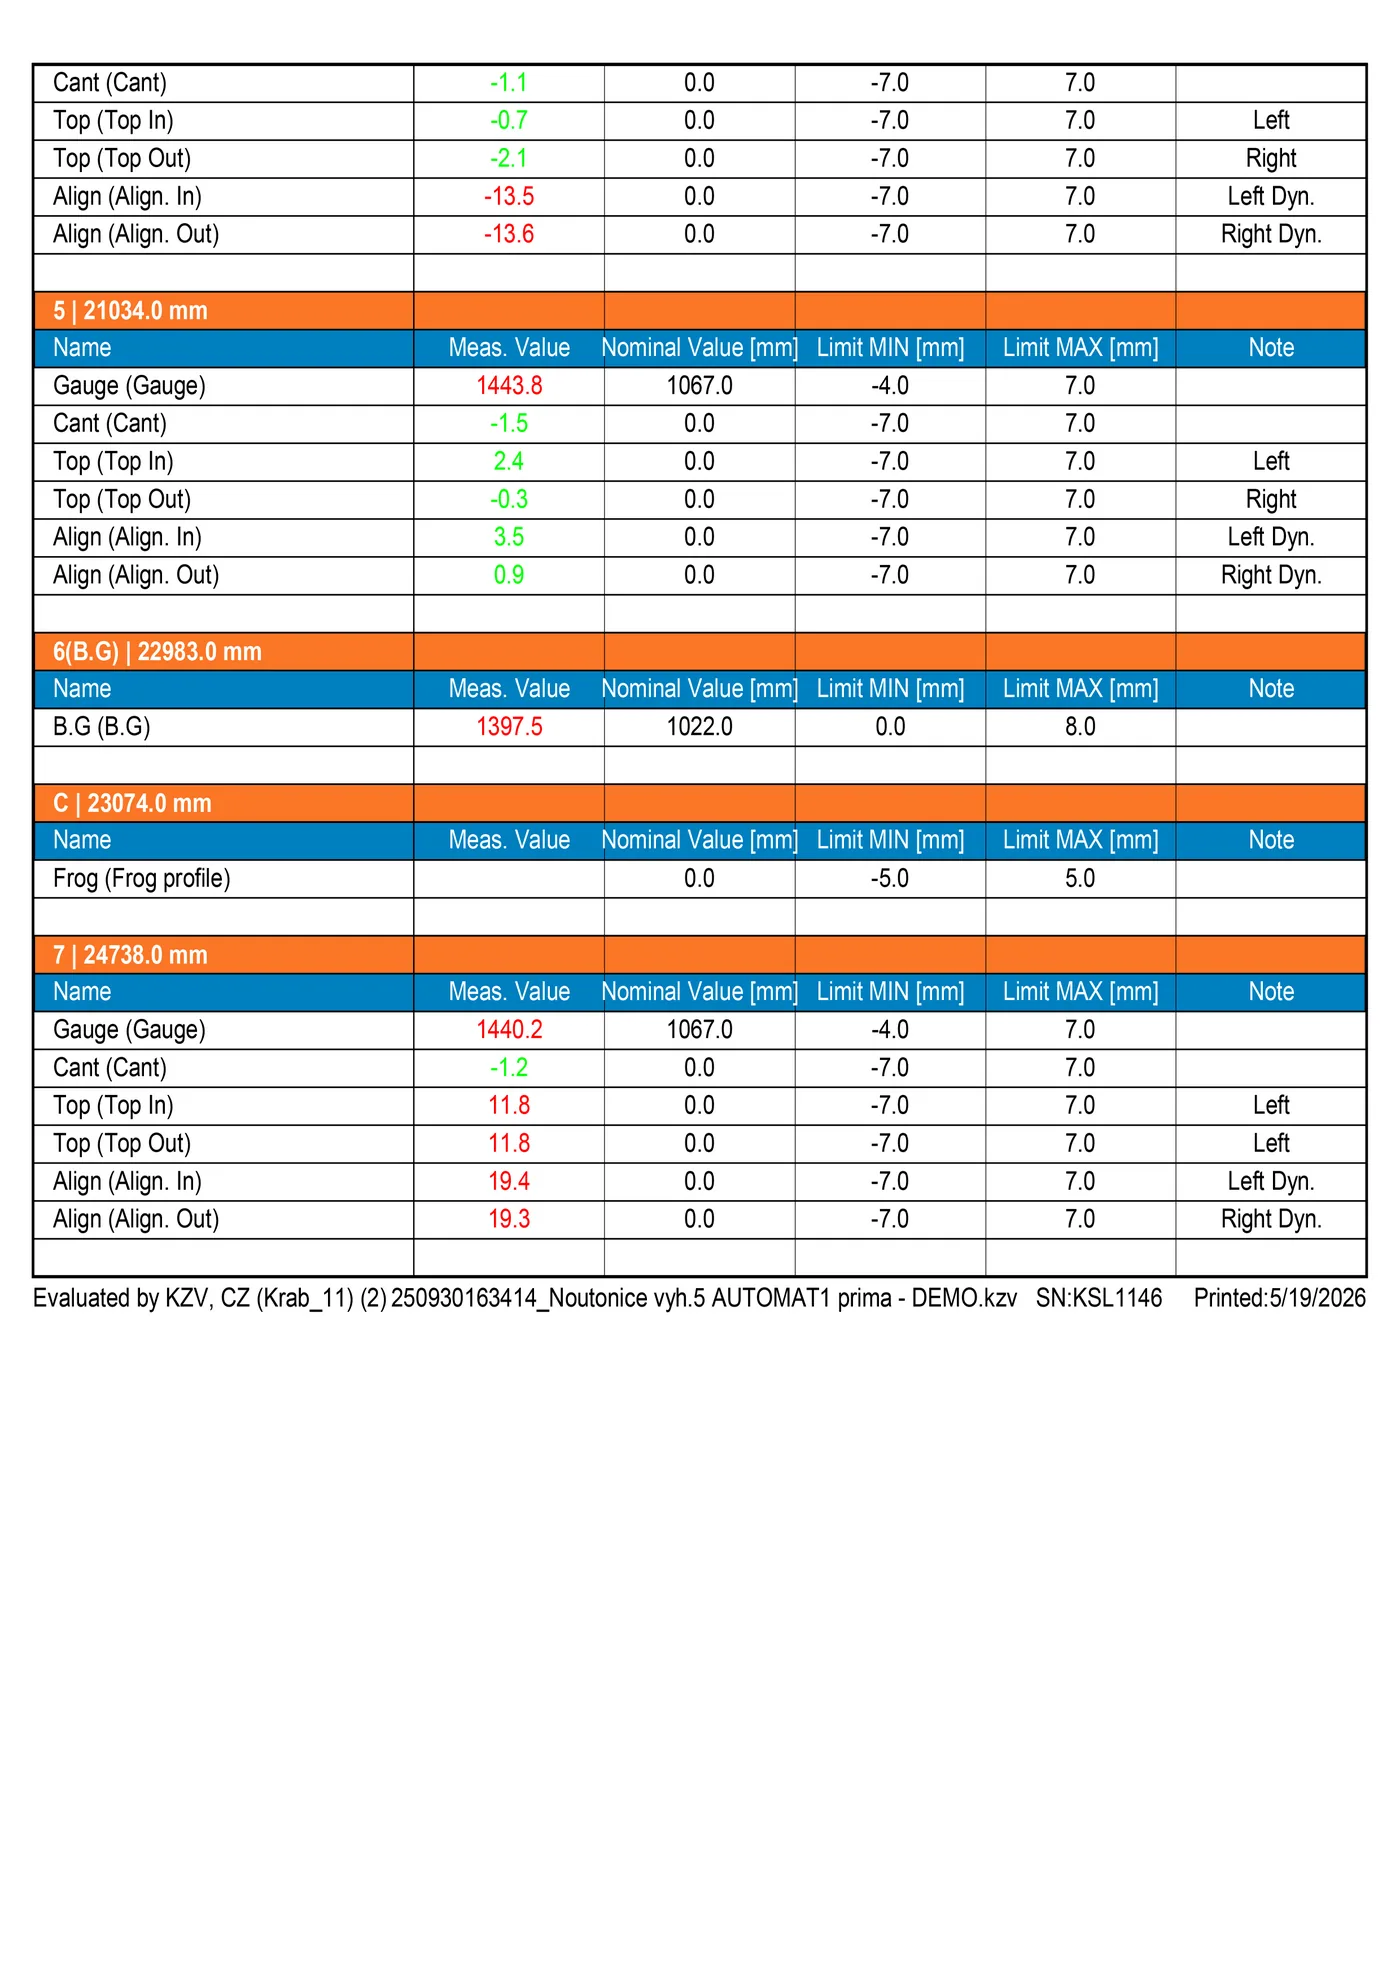
Report: switch evaluation combined with the corresponding rail profile data
Key Features
Track Geometry Evaluation
Cant, top, alignment, gauge and twist processed with configurable calculation methods, including space curves and chord evaluation
Custom Evaluation Templates
User-defined calculations, limits, wavebands, filters, speed zones and switch types, reusable across projects and networks
Local Defect Detection
Automatic detection against selectable limits, with maximum value, length, limit level and GPS location for every defect
Section Evaluation & Quality Index
Acceptance and maintenance evaluations, quality index calculation and section-based condition assessment
Rail Profile & Grinding Analysis
Wear and grinding analysis for both vignole and grooved rails, compared against reference profiles, with GQI reporting
Switch Evaluation with ASI
Detailed reports for every inspection point of a switch, with integrated support for Automatic Switch Inspection (ASI)
Graphical Analysis Tools
Multi-channel display, signal comparison, adjustable scales, zoom and highlighting of limit exceedances
Track Mapping & Video
GPS-referenced results shown on the track map and synchronized with the recorded track video
Technical Specifications
| Platform | Windows 7, 8, 10, 11 |
|---|---|
| RAM | 4 GB minimum, 8 GB recommended |
| Disk Space | 1 GB available |
| Display | 1280 × 1024 or higher |
| Data Formats | .kzv, .krx (KZV measurement files) |
| Wavebands | D1 (1–25 m), D2 (25–70 m) according to EN 13848 |
| Exports | CSV, XLSX, PDF, printed reports |
Compatible Hardware
This software works with the following KZV products:
Evaluation Templates
Every network has its own rules. A KRAB 11 template holds the calculation methods (space curves, chord evaluation), the limits, wavebands and filters, speed zones, section criteria, switch type definitions and rail profile parameters. It is set up once and applied to every measurement of that network, so results compare across years, lines and operators.
Local Defects and Section Quality
Defects are detected against the selected limits and listed with their maximum value, length, limit level and GPS position; they appear on the track map and, where recorded, in the synchronized track video. Sections are evaluated for acceptance or maintenance, with quality indices, defect summaries and statistics that support the prioritization of work.
Rail Profiles
Measured profiles of vignole and grooved rails are compared with a reference profile, the nominal one or an earlier measurement. That gives the total wear, its development over time and the basis for grinding plans: grinding analysis and GQI reports, section by section, exported to the usual formats.
Switches
Every inspection point of a switch and crossing (turnout) is reported with its value, its limit and the corresponding rail profile. KRAB 11 holds the ASI databases of switch types and of the switches in the network; KrabDroid 3.0 loads them for the run and locates the inspection points automatically once the operator marks the start or the end of the switch.
From Measurement to Maintenance Plan
- Measure: KrabDroid 3.0 (Android) or Krab OnBoard (Windows) with a KRAB trolley
- Evaluate: KRAB 11 on Windows: geometry, local defects, sections, rail profiles and switches
- Report: tables, multi-channel graphs and printable reports, exported to CSV, XLSX or PDF
- Plan: maintenance and grinding prioritized on measured data
KRAB 11 is used on railways, metros and tramways, is configured to local standards and regulations, and is developed continuously with customer feedback.
Ready to Get Started?
Contact us for detailed information, pricing, training, and technical support