
Gekon 11
Rail corrugation and profile evaluation according to EN 13231-2/3
Windows evaluation software for rail corrugation and rail profile data measured with GEKON trolleys
Standards Compliance
✓ EN 13231-2 • EN 13231-3
Why Choose Gekon 11?
Five Wavebands
Corrugation evaluated in the EN 13231-2/3 wavebands D1 (0–30 mm), D2 (30–100 mm), D3 (100–300 mm) and D4 (300–1000 mm), plus D5, a band the customer defines (1000–3000 mm by default).
Evaluation Templates
Calculation methods, limits and reporting criteria configured once and applied automatically, so results stay consistent across the whole network.
Signals in Detail
Multi-channel graphs of the D1–D5 signals, comparison of two signals or two data files, and highlighted limit exceedances with their values.
Grinding Decisions
Section evaluation, Dx grind reports, groove and flange wear, GQI reporting and 1/3 octave analysis support objective grinding planning.
See It in Action
Screenshots from the application
Gekon 11 in 55 seconds: corrugation signals in the wavebands, rail profile comparison, 1/3 octave analysis and the synchronized track video
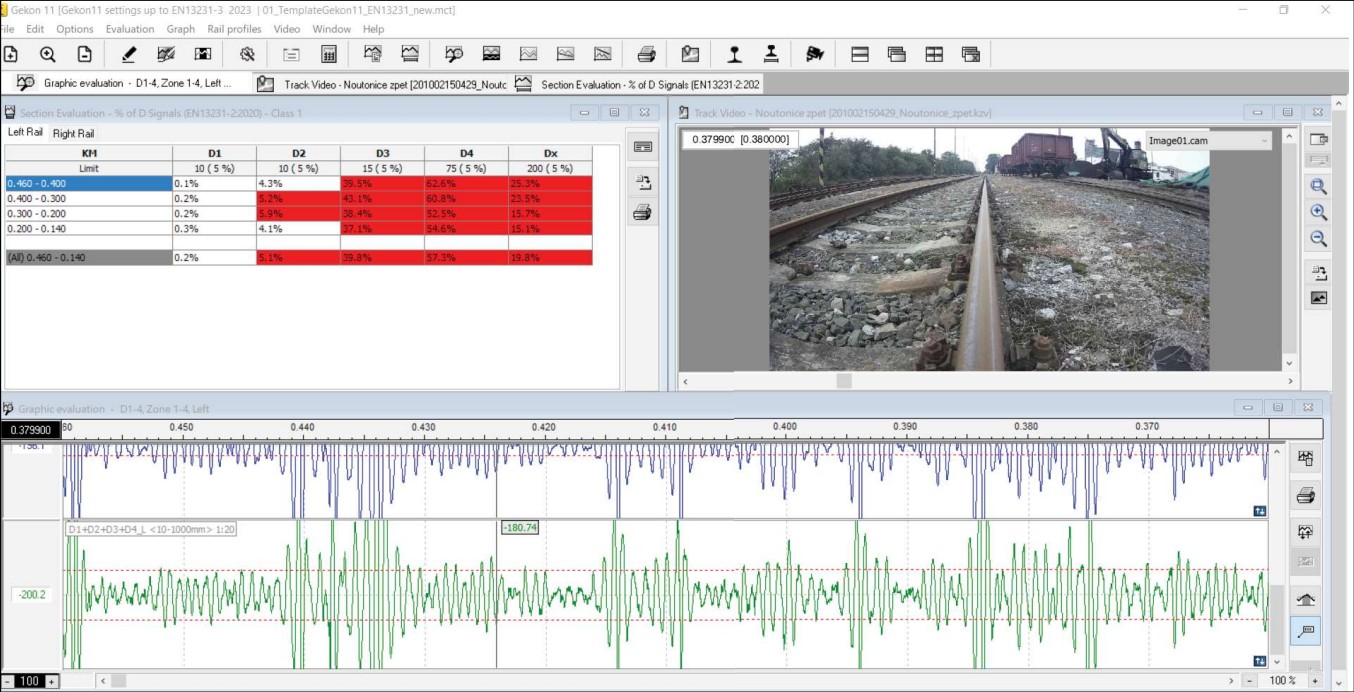
Section evaluation (% of D signals) with the D1–D4 graphic evaluation and synchronized track video
Key Features
D1–D5 Waveband Evaluation
Corrugation calculated in five wavebands from 0–30 mm up to 1000–3000 mm according to EN 13231-2/3
Configurable Evaluation Parameters
Peak-to-Peak Moving Average, Peak-to-Peak Isolated Points and Limit exceedance (% of D signals), with user-defined limits and filters
Section Evaluation
Peak-to-Peak % (Class 1 / Class 2), RMS % and RMS of the D signals per evaluated section
Graphical Analysis
Multi-channel display, adjustable scales and layouts, zoom, comparison of two signals or two data files
Rail Profile Evaluation
Vignole and grooved rails compared with a reference profile, rail head wear at multiple angles, groove width/depth and flange wear
Grind and GQI Reports
Dx grind reports and GQI reporting for wear monitoring and grinding preparation
1/3 Octave Analysis
Spectral evaluation of the measured signals for noise analysis
Track Mapping and Export
Measured track shown on Google Earth maps; results exported to CSV, TXT, PDF or DXF
Technical Specifications
| Platform | Windows 7, 8, 10, 11 |
|---|---|
| RAM | 4 GB minimum, 8 GB recommended |
| Disk Space | 1 GB available |
| Display | 1280 × 1024 or higher |
| Data Format | .kzv (measured with RC Droid 3.0 or Krab OnBoard 2.0) |
| Wavebands | D1 (0–30 mm), D2 (30–100 mm), D3 (100–300 mm), D4 (300–1000 mm) per EN 13231-2/3; D5 user-defined (1000–3000 mm by default) |
| Exports | CSV, TXT, PDF, DXF, Google Earth |
Compatible Hardware
This software works with the following KZV products:
Wavebands and Evaluation Templates
An evaluation template holds the calculation methods, the limits, the filters and the reporting criteria demanded by EN 13231-2/3, by national regulations or by a project specification. It is set up once and applied to every measurement, so results compare across the whole network. The corrugation signal is evaluated in the five wavebands D1 to D5 with the selected parameter: Peak-to-Peak Moving Average, Peak-to-Peak Isolated Points or limit exceedance as a percentage of the D signals. Graph layouts and rail profile evaluation parameters belong to the template as well.
Signals and Sections
The D1–D5 signals are displayed on multiple channels with adjustable scales, and two signals or two data files can be put side by side, which shows how a section has developed between two runs. Limit exceedances are highlighted with their values, and the measured track is followed on the map and in the synchronized track video. Each evaluated section is summarized by Peak-to-Peak % for Class 1 and Class 2, RMS %, the RMS of the D signals and the limit exceedance.
Rail Profiles and Grinding
Vignole and grooved rails are compared with a reference profile to monitor wear or to prepare a grinding plan. Gekon 11 calculates rail head wear at several angles, groove width and depth and rail flange wear, and produces Dx grind reports and GQI reporting. The 1/3 octave analysis of the measured signals serves the spectral evaluation of rolling noise.
From Measurement to Grinding Plan
- Measure: RC Droid 3.0 (Android) or Krab OnBoard 2.0 (Windows) with a GEKON trolley
- Evaluate: Gekon 11 on Windows — corrugation in the D1 to D4 wavebands and the custom D5 band, section evaluation and rail profiles
- Report: tables, graphs, 1/3 octave analysis and Dx grind reports
- Plan: grinding and maintenance based on objective severity data
Videos
Gekon 11 Software
Gekon 11 evaluating rail corrugation and profile data recorded with a GEKON trolley: waveband analysis of the rail surface, rail profile graphs and report generation.
Ready to Get Started?
Contact us for detailed information, pricing, training, and technical support