
Equivalent Conicity
Wheel–rail contact geometry and tan γe from measured rail profiles, verified against every test case of the standard
KZV's own implementation of equivalent conicity according to EN 15302 — real time in Krab OnBoard, as a library in your software, or as an interactive program
Standards Compliance
✓ EN 15302
Why Choose Equivalent Conicity?
Passes Every Test of EN 15302
Our implementation reproduces all reference results of the standard's test cases (Annexes I to K): contact points, rolling radius difference and tan γe, each within the tolerance the standard prescribes.
Two-Step Integration
Equivalent conicity is calculated with the two-step integration method, which gives a reliable tan γe even for worn and irregular profiles, where a simple linear regression falls apart.
Fast Enough for Real Time
Thousands of rail profiles per second on ordinary consumer hardware. The calculation keeps pace with the profile scanners during the run, so the equivalent conicity of the measured track is known while the trolley is still moving.
Three Ways to Get It
In real time in Krab OnBoard, integrated into your own software as a custom-built library, or as an interactive program for exploring the wheel–rail contact in detail.
See It in Action
Screenshots from the application
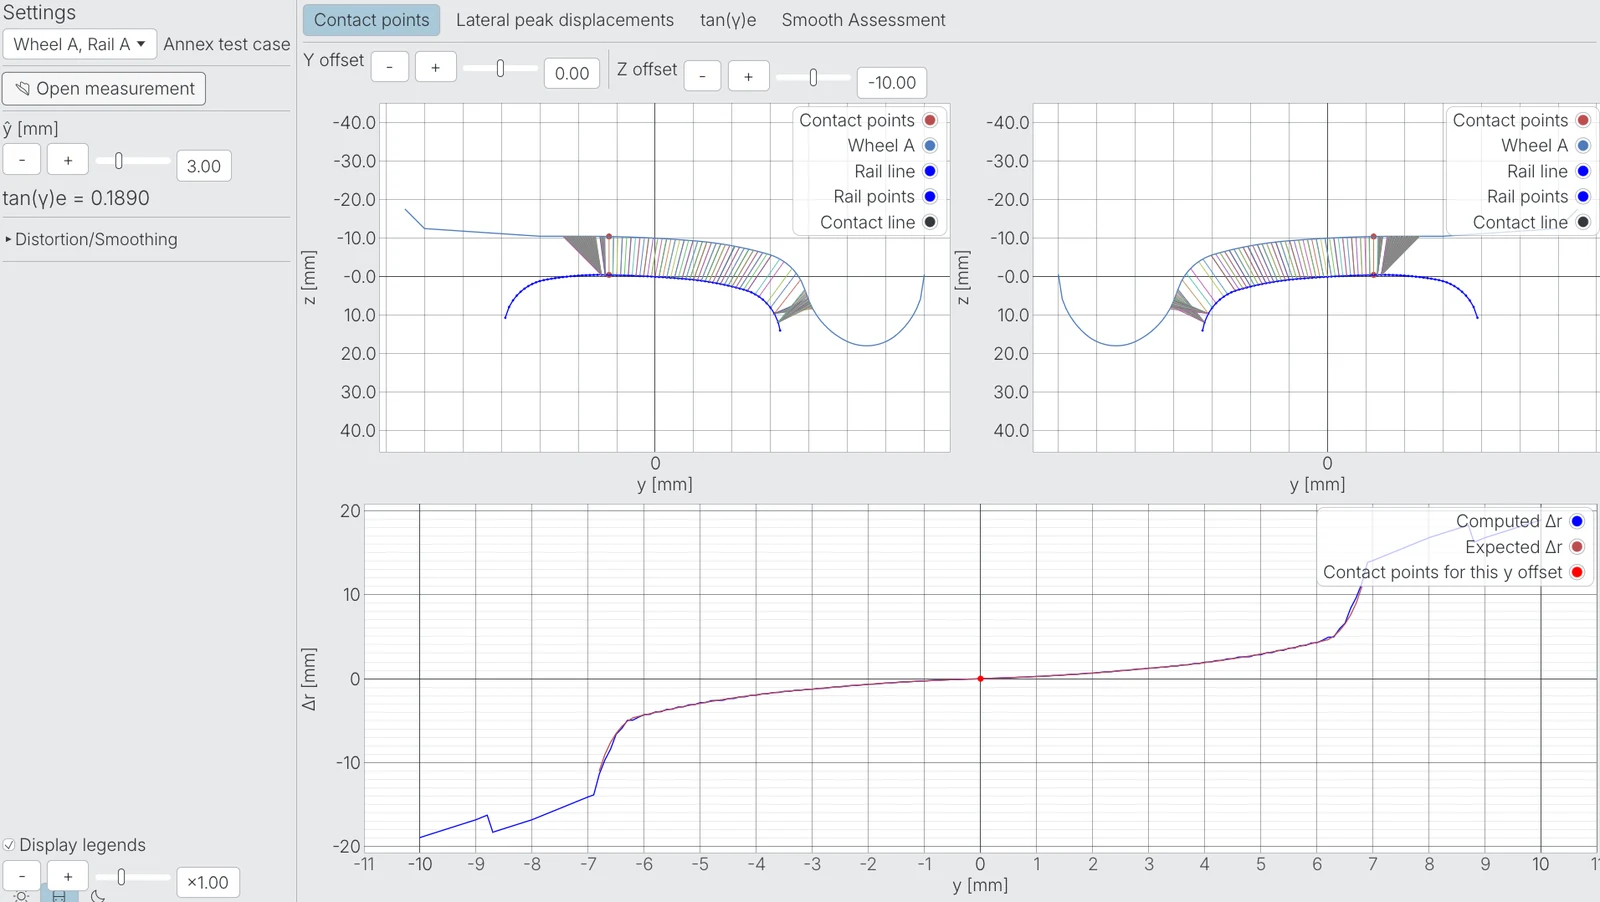
Contact points: wheel and rail profiles of both sides with the contact lines for every lateral displacement, and below them the rolling radius difference Δr against the displacement, computed and expected
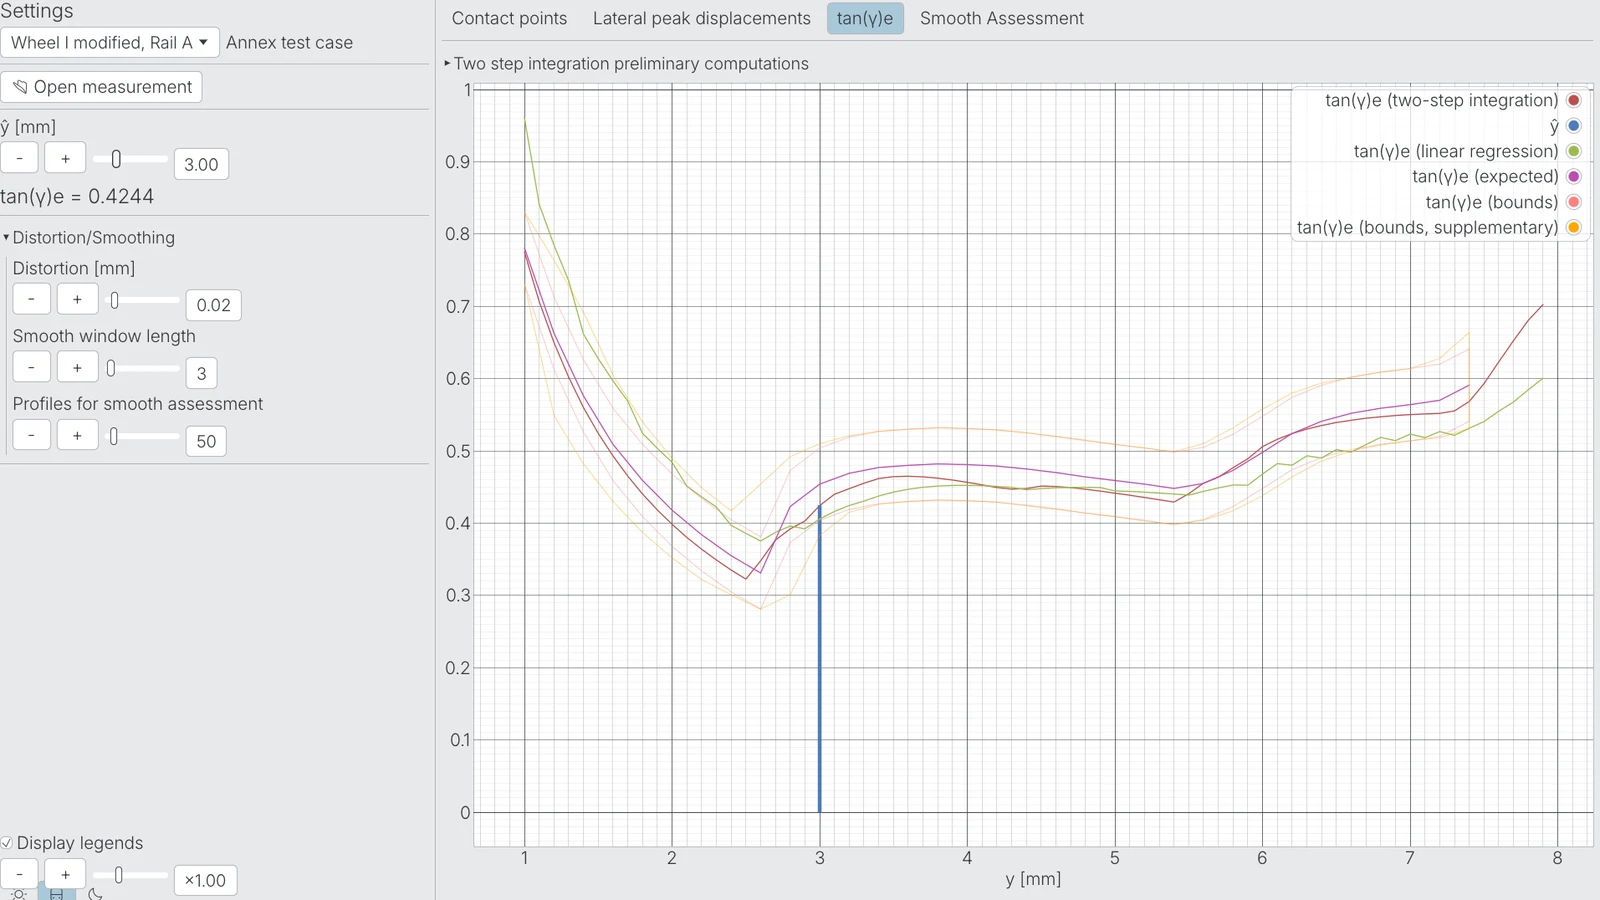
tan γe against the amplitude ŷ for a worn wheel from the standard's test cases: two-step integration compared with linear regression, the expected curve and the tolerance bounds of EN 15302
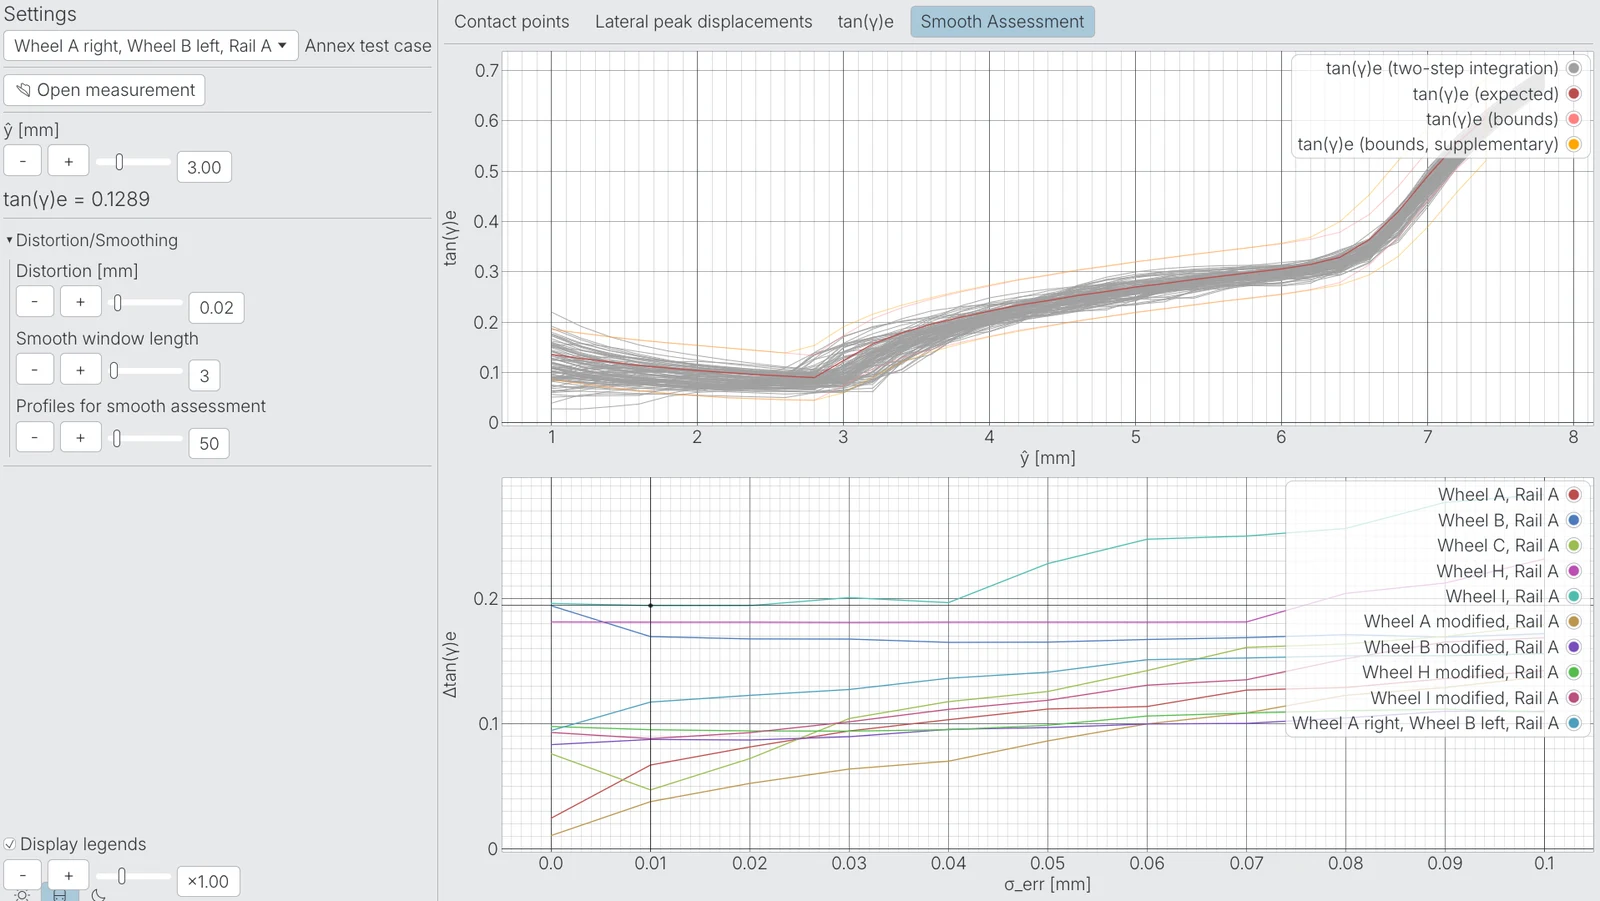
Smooth assessment: the same profile pair distorted 50 times with random measurement noise, and the spread of tan γe as the noise grows, for every wheel and rail combination of the standard
Key Features
Equivalent Conicity per EN 15302
tan γe calculated for the amplitude of the standard (3 mm) or any other amplitude, with the two-step integration method
Contact Geometry
Contact points, contact angles and the rolling radius difference Δr for every lateral displacement of the wheelset
Any Wheel, Any Rail
Measured rail profiles and gauge from the trolley, wheel profiles from a CSV file (nominal or measured), lateral and vertical offsets
Test Cases of the Standard
The wheel and rail profiles of Annexes I to K are built in, so the result can be checked against the standard at any time
Noise Robustness
Smooth assessment: the sensitivity of tan γe to measurement noise, shown for a configurable number of randomly distorted profiles
Real Time in Krab OnBoard
The conicity of the measured track calculated during the run, from the gauge and the two rail profiles measured together by the trolley
Library for Your Software
The calculation core integrated into the customer's own evaluation or monitoring software on request
Interactive Program
A stand-alone program for Windows, Linux or the web browser to load measured profiles and explore the contact geometry, tan γe and its sensitivity
Technical Specifications
| Standard | EN 15302 (equivalent conicity), all test cases of Annexes I to K passed |
|---|---|
| Method | Two-step integration; linear regression for comparison |
| Throughput | Thousands of rail profiles per second on consumer hardware |
| Results | tan γe, contact points, contact angles, rolling radius difference Δr, lateral peak displacements |
| Inputs | Rail profiles and gauge measured with KZV trolleys (.kzv); wheel profiles from a CSV file, nominal or measured; lateral and vertical offsets |
| Delivery | Real time in Krab OnBoard 2.0 and 3.0; library integrated into the customer's software on request; interactive program |
| Platform (interactive program) | Windows, Linux, web browser |
Compatible Hardware
This software works with the following KZV products:
What Equivalent Conicity Is
A railway wheelset is self-steering because its wheels are conical: shifted sideways, the wheel on one side rolls on a larger radius than the wheel on the other side, and the wheelset steers back to the center. How strongly it does so is the equivalent conicity, tan γe. Too low and the vehicle wanders in the track; too high and the wheelset hunts, a sinusoidal oscillation that shakes the vehicle and wears the rails. Because real wheels and rails are not cones, tan γe depends on the actual shape of both profiles, on the gauge and on the rail inclination, and it changes as the rails wear. EN 15302 defines how it is calculated from the two profiles, and infrastructure managers use it to decide where the rails need grinding or reprofiling.
Our Implementation
KZV has its own implementation of EN 15302. It is verified against every test case published in the standard (Annexes I to K): for each pair of wheel and rail profiles, the contact points, the rolling radius difference Δr and the tan γe curve match the reference results within the tolerances the standard sets. The calculation uses the two-step integration method, which is the more robust of the methods the standard allows: it gives a stable result for worn profiles with sudden changes in the contact geometry, where linear regression is unreliable.
The implementation is efficient: it processes thousands of rail profiles per second on ordinary consumer hardware. That is far more than the profile scanners deliver, so the equivalent conicity of the measured track is calculated during the run rather than in the office afterwards.
How It Is Delivered
- Real time in Krab OnBoard: the conicity of the track under the trolley or the measuring vehicle, calculated during the run from the gauge and the two rail profiles the trolley measures together (Krab OnBoard, version 2.0 and 3.0)
- In your own software: the calculation core is integrated into the customer's evaluation, monitoring or asset-management software on request
- Interactive program: a stand-alone program for Windows, Linux or the web browser to load measured profiles and explore the contact points, the rolling radius difference, tan γe and its sensitivity to measurement noise
Contact Geometry in Detail
The interactive program shows what goes into the number. Wheel profiles come from a CSV file, nominal or measured; rail profiles and gauge from the measurement. For a chosen wheel and rail pair, the contact points for every lateral displacement are drawn on both profiles, and the resulting rolling radius difference Δr is plotted against the displacement. The tan γe curve is shown against the amplitude ŷ, with the two-step integration result next to the linear regression, the expected curve of the standard's test case and its tolerance bounds. The smooth assessment distorts the profiles with random measurement noise of a chosen magnitude and repeats the calculation many times, which shows how much a given scanner accuracy can move the result. The wheel and rail profiles of the standard's test cases are built in.
From Measured Profiles to Conicity
- Measure: gauge and both rail profiles in one run with KRAB Heavy, KRAB S-LIGHT or TURTLE fitted with profile scanners
- Calculate: tan γe in real time in Krab OnBoard, in your own software or in the interactive program
- Decide: where the rails need grinding or reprofiling, based on the conicity along the track
Ready to Get Started?
Contact us for detailed information, pricing, training, and technical support